Zip Codes with the Highest Percentage of Population Employed in Food Preparation & Serving in Northampton, MA
RELATED REPORTS & OPTIONS
Food Preparation & Serving
Northampton
Compare Zip Codes
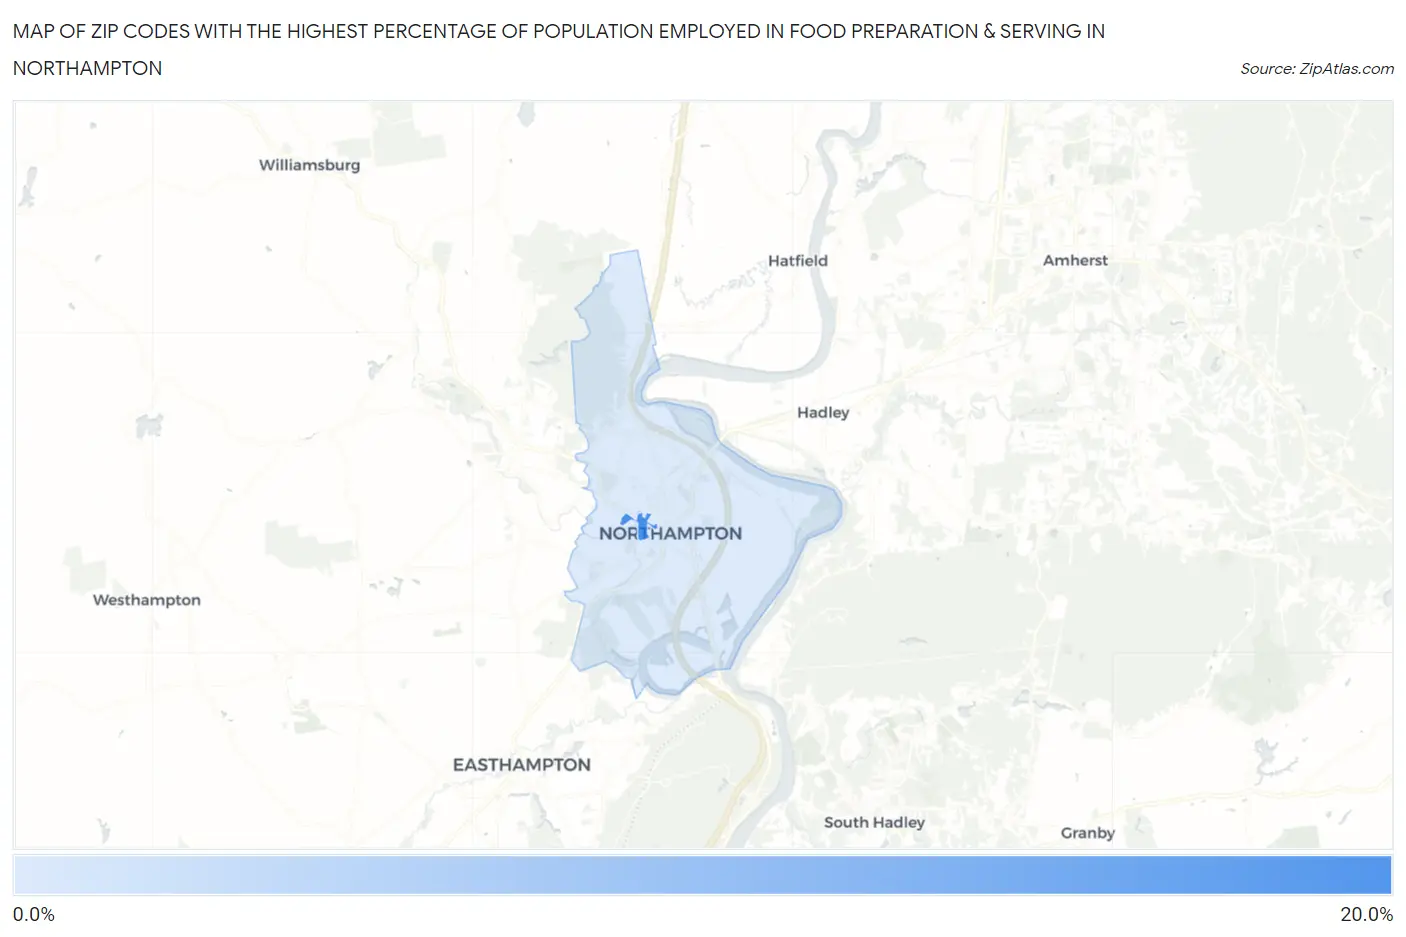
Map of Zip Codes with the Highest Percentage of Population Employed in Food Preparation & Serving in Northampton
0.0%
20.0%
Zip Codes with the Highest Percentage of Population Employed in Food Preparation & Serving in Northampton, MA
| Zip Code | % Employed | vs State | vs National | |
| 1. | 01063 | 19.3% | 4.6%(+14.7)#6 | 5.3%(+14.0)#547 |
| 2. | 01060 | 6.7% | 4.6%(+2.12)#79 | 5.3%(+1.45)#7,257 |
1
Common Questions
What are the Top Zip Codes with the Highest Percentage of Population Employed in Food Preparation & Serving in Northampton, MA?
Top Zip Codes with the Highest Percentage of Population Employed in Food Preparation & Serving in Northampton, MA are:
What zip code has the Highest Percentage of Population Employed in Food Preparation & Serving in Northampton, MA?
01063 has the Highest Percentage of Population Employed in Food Preparation & Serving in Northampton, MA with 19.3%.
What is the Percentage of Population Employed in Food Preparation & Serving in Northampton, MA?
Percentage of Population Employed in Food Preparation & Serving in Northampton is 7.2%.
What is the Percentage of Population Employed in Food Preparation & Serving in Massachusetts?
Percentage of Population Employed in Food Preparation & Serving in Massachusetts is 4.6%.
What is the Percentage of Population Employed in Food Preparation & Serving in the United States?
Percentage of Population Employed in Food Preparation & Serving in the United States is 5.3%.