Zip Codes with the Highest Percentage of Population Employed in Architecture & Engineering in Haverhill, MA
RELATED REPORTS & OPTIONS
Architecture & Engineering
Haverhill
Compare Zip Codes
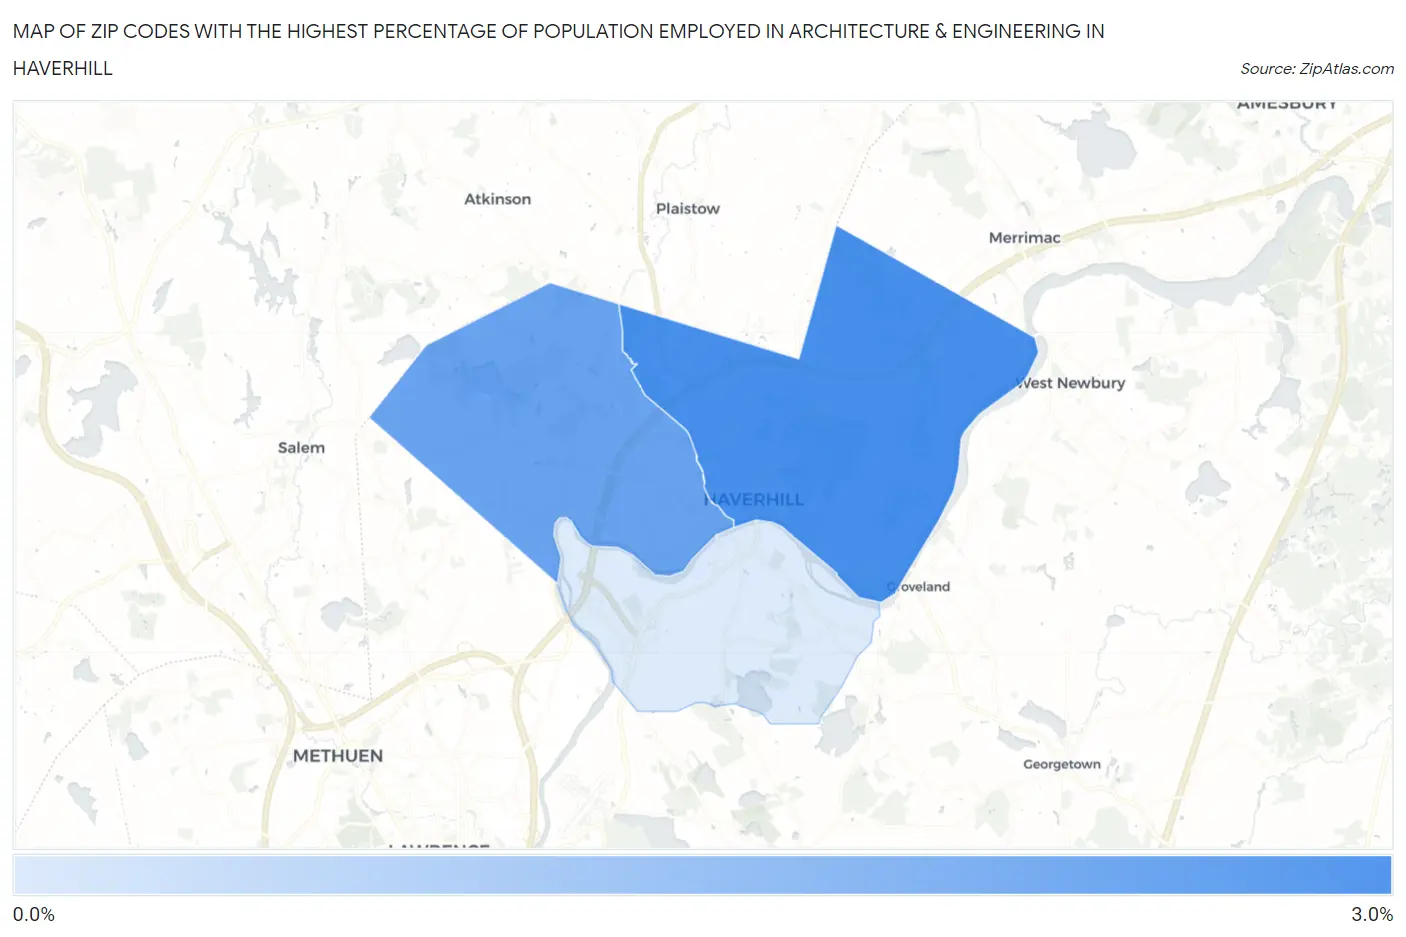
Map of Zip Codes with the Highest Percentage of Population Employed in Architecture & Engineering in Haverhill
0.0%
3.0%
Zip Codes with the Highest Percentage of Population Employed in Architecture & Engineering in Haverhill, MA
| Zip Code | % Employed | vs State | vs National | |
| 1. | 01830 | 2.6% | 2.7%(-0.031)#208 | 2.1%(+0.494)#6,397 |
| 2. | 01832 | 2.2% | 2.7%(-0.458)#259 | 2.1%(+0.066)#8,406 |
| 3. | 01835 | 0.69% | 2.7%(-1.98)#441 | 2.1%(-1.46)#18,936 |
1
Common Questions
What are the Top Zip Codes with the Highest Percentage of Population Employed in Architecture & Engineering in Haverhill, MA?
Top Zip Codes with the Highest Percentage of Population Employed in Architecture & Engineering in Haverhill, MA are:
What zip code has the Highest Percentage of Population Employed in Architecture & Engineering in Haverhill, MA?
01830 has the Highest Percentage of Population Employed in Architecture & Engineering in Haverhill, MA with 2.6%.
What is the Percentage of Population Employed in Architecture & Engineering in Haverhill, MA?
Percentage of Population Employed in Architecture & Engineering in Haverhill is 2.0%.
What is the Percentage of Population Employed in Architecture & Engineering in Massachusetts?
Percentage of Population Employed in Architecture & Engineering in Massachusetts is 2.7%.
What is the Percentage of Population Employed in Architecture & Engineering in the United States?
Percentage of Population Employed in Architecture & Engineering in the United States is 2.1%.