Zip Codes with the Highest Percentage of Population Enrolled in Nursery / Preschool in Louisville, KY
RELATED REPORTS & OPTIONS
Nursery / Preschool
Louisville
Compare Zip Codes
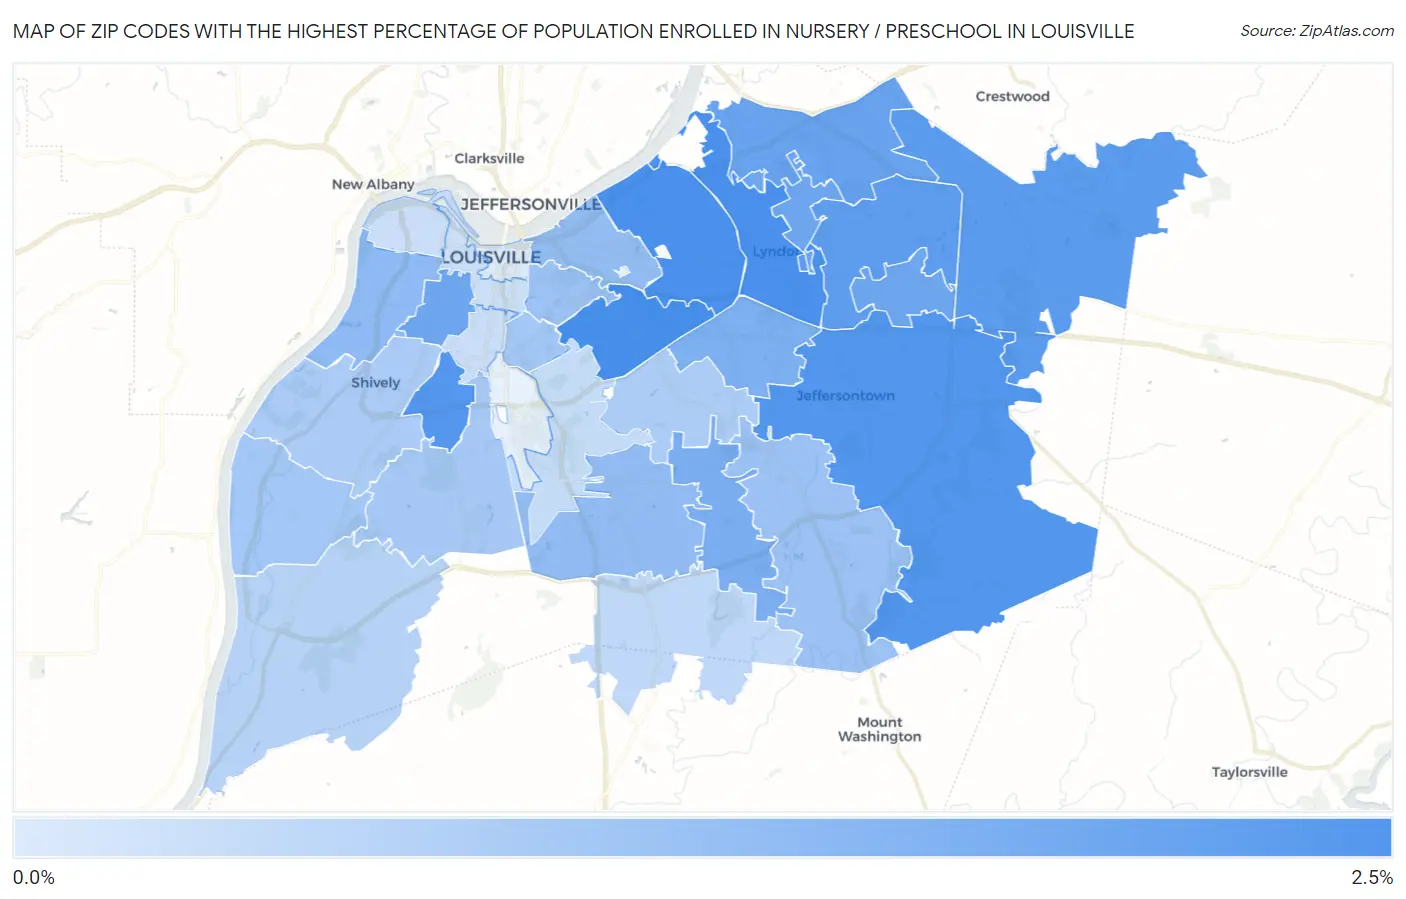
Map of Zip Codes with the Highest Percentage of Population Enrolled in Nursery / Preschool in Louisville
0.0%
2.5%
Zip Codes with the Highest Percentage of Population Enrolled in Nursery / Preschool in Louisville, KY
| Zip Code | % in Nursery | vs State | vs National | |
| 1. | 40205 | 2.3% | 1.4%(+0.933)#97 | 1.4%(+0.893)#4,167 |
| 2. | 40222 | 2.3% | 1.4%(+0.908)#100 | 1.4%(+0.867)#4,270 |
| 3. | 40207 | 2.3% | 1.4%(+0.901)#102 | 1.4%(+0.860)#4,300 |
| 4. | 40299 | 2.2% | 1.4%(+0.769)#117 | 1.4%(+0.728)#4,960 |
| 5. | 40215 | 2.1% | 1.4%(+0.719)#120 | 1.4%(+0.679)#5,237 |
| 6. | 40245 | 2.0% | 1.4%(+0.632)#134 | 1.4%(+0.592)#5,825 |
| 7. | 40223 | 2.0% | 1.4%(+0.593)#141 | 1.4%(+0.553)#6,112 |
| 8. | 40241 | 1.8% | 1.4%(+0.441)#158 | 1.4%(+0.400)#7,281 |
| 9. | 40210 | 1.8% | 1.4%(+0.362)#170 | 1.4%(+0.321)#8,029 |
| 10. | 40243 | 1.8% | 1.4%(+0.344)#172 | 1.4%(+0.303)#8,204 |
| 11. | 40242 | 1.7% | 1.4%(+0.340)#174 | 1.4%(+0.299)#8,252 |
| 12. | 40228 | 1.6% | 1.4%(+0.186)#195 | 1.4%(+0.145)#9,912 |
| 13. | 40220 | 1.6% | 1.4%(+0.152)#208 | 1.4%(+0.112)#10,288 |
| 14. | 40211 | 1.3% | 1.4%(-0.132)#251 | 1.4%(-0.172)#13,865 |
| 15. | 40219 | 1.3% | 1.4%(-0.141)#254 | 1.4%(-0.181)#13,982 |
| 16. | 40206 | 1.2% | 1.4%(-0.180)#263 | 1.4%(-0.220)#14,528 |
| 17. | 40291 | 1.1% | 1.4%(-0.285)#286 | 1.4%(-0.326)#15,905 |
| 18. | 40204 | 1.1% | 1.4%(-0.318)#296 | 1.4%(-0.358)#16,334 |
| 19. | 40258 | 0.98% | 1.4%(-0.424)#318 | 1.4%(-0.465)#17,767 |
| 20. | 40217 | 0.97% | 1.4%(-0.435)#319 | 1.4%(-0.476)#17,912 |
| 21. | 40214 | 0.94% | 1.4%(-0.467)#325 | 1.4%(-0.508)#18,317 |
| 22. | 40216 | 0.89% | 1.4%(-0.514)#336 | 1.4%(-0.555)#18,919 |
| 23. | 40218 | 0.85% | 1.4%(-0.560)#347 | 1.4%(-0.600)#19,453 |
| 24. | 40272 | 0.73% | 1.4%(-0.682)#372 | 1.4%(-0.723)#20,842 |
| 25. | 40229 | 0.59% | 1.4%(-0.822)#392 | 1.4%(-0.862)#22,259 |
| 26. | 40213 | 0.49% | 1.4%(-0.918)#411 | 1.4%(-0.959)#23,134 |
| 27. | 40212 | 0.42% | 1.4%(-0.989)#426 | 1.4%(-1.03)#23,727 |
| 28. | 40208 | 0.41% | 1.4%(-1.00)#428 | 1.4%(-1.04)#23,814 |
| 29. | 40203 | 0.40% | 1.4%(-1.01)#430 | 1.4%(-1.05)#23,873 |
| 30. | 40202 | 0.15% | 1.4%(-1.26)#467 | 1.4%(-1.30)#25,335 |
1
Common Questions
What are the Top 10 Zip Codes with the Highest Percentage of Population Enrolled in Nursery / Preschool in Louisville, KY?
Top 10 Zip Codes with the Highest Percentage of Population Enrolled in Nursery / Preschool in Louisville, KY are:
What zip code has the Highest Percentage of Population Enrolled in Nursery / Preschool in Louisville, KY?
40205 has the Highest Percentage of Population Enrolled in Nursery / Preschool in Louisville, KY with 2.3%.
What is the Percentage of Population Enrolled in Nursery / Preschool in Louisville, KY?
Percentage of Population Enrolled in Nursery / Preschool in Louisville is 1.2%.
What is the Percentage of Population Enrolled in Nursery / Preschool in Kentucky?
Percentage of Population Enrolled in Nursery / Preschool in Kentucky is 1.4%.
What is the Percentage of Population Enrolled in Nursery / Preschool in the United States?
Percentage of Population Enrolled in Nursery / Preschool in the United States is 1.4%.