Zip Codes with the Highest Percentage of Population Employed in Architecture & Engineering in Louisville, KY
RELATED REPORTS & OPTIONS
Architecture & Engineering
Louisville
Compare Zip Codes
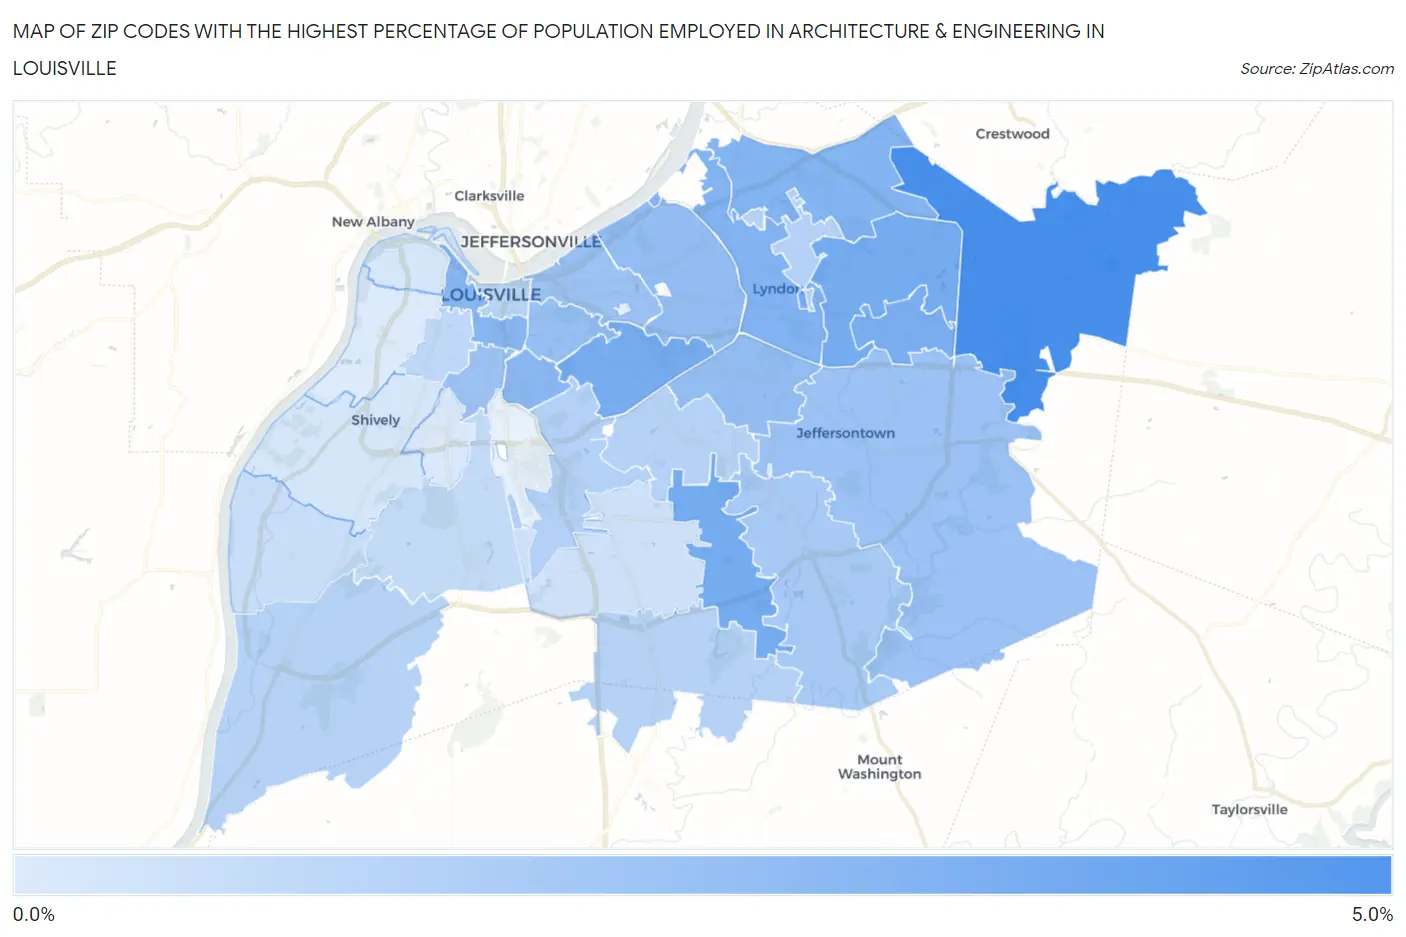
Map of Zip Codes with the Highest Percentage of Population Employed in Architecture & Engineering in Louisville
0.0%
5.0%
Zip Codes with the Highest Percentage of Population Employed in Architecture & Engineering in Louisville, KY
| Zip Code | % Employed | vs State | vs National | |
| 1. | 40245 | 4.8% | 1.7%(+3.06)#32 | 2.1%(+2.61)#1,872 |
| 2. | 40223 | 3.3% | 1.7%(+1.62)#60 | 2.1%(+1.17)#4,156 |
| 3. | 40228 | 3.3% | 1.7%(+1.62)#61 | 2.1%(+1.17)#4,165 |
| 4. | 40205 | 3.2% | 1.7%(+1.54)#65 | 2.1%(+1.09)#4,360 |
| 5. | 40243 | 3.2% | 1.7%(+1.51)#67 | 2.1%(+1.06)#4,427 |
| 6. | 40222 | 2.9% | 1.7%(+1.23)#82 | 2.1%(+0.783)#5,310 |
| 7. | 40241 | 2.9% | 1.7%(+1.20)#84 | 2.1%(+0.748)#5,429 |
| 8. | 40203 | 2.7% | 1.7%(+1.05)#89 | 2.1%(+0.598)#5,976 |
| 9. | 40217 | 2.7% | 1.7%(+0.955)#96 | 2.1%(+0.505)#6,349 |
| 10. | 40220 | 2.4% | 1.7%(+0.729)#106 | 2.1%(+0.280)#7,339 |
| 11. | 40207 | 2.4% | 1.7%(+0.666)#114 | 2.1%(+0.216)#7,647 |
| 12. | 40204 | 2.3% | 1.7%(+0.590)#117 | 2.1%(+0.140)#8,001 |
| 13. | 40206 | 2.2% | 1.7%(+0.496)#123 | 2.1%(+0.046)#8,494 |
| 14. | 40299 | 2.2% | 1.7%(+0.490)#124 | 2.1%(+0.040)#8,534 |
| 15. | 40208 | 2.2% | 1.7%(+0.452)#127 | 2.1%(+0.002)#8,750 |
| 16. | 40291 | 1.8% | 1.7%(+0.099)#149 | 2.1%(-0.351)#10,829 |
| 17. | 40213 | 1.4% | 1.7%(-0.279)#184 | 2.1%(-0.728)#13,427 |
| 18. | 40242 | 1.4% | 1.7%(-0.316)#188 | 2.1%(-0.766)#13,710 |
| 19. | 40229 | 1.3% | 1.7%(-0.351)#194 | 2.1%(-0.801)#13,968 |
| 20. | 40272 | 1.3% | 1.7%(-0.361)#196 | 2.1%(-0.811)#14,039 |
| 21. | 40218 | 1.3% | 1.7%(-0.389)#199 | 2.1%(-0.839)#14,243 |
| 22. | 40202 | 1.2% | 1.7%(-0.500)#219 | 2.1%(-0.950)#15,076 |
| 23. | 40210 | 1.1% | 1.7%(-0.647)#238 | 2.1%(-1.10)#16,231 |
| 24. | 40214 | 0.94% | 1.7%(-0.760)#257 | 2.1%(-1.21)#17,050 |
| 25. | 40258 | 0.80% | 1.7%(-0.895)#275 | 2.1%(-1.35)#18,104 |
| 26. | 40219 | 0.60% | 1.7%(-1.10)#298 | 2.1%(-1.55)#19,627 |
| 27. | 40216 | 0.38% | 1.7%(-1.32)#318 | 2.1%(-1.77)#21,065 |
| 28. | 40212 | 0.38% | 1.7%(-1.32)#320 | 2.1%(-1.77)#21,122 |
| 29. | 40215 | 0.24% | 1.7%(-1.46)#335 | 2.1%(-1.91)#21,872 |
| 30. | 40211 | 0.16% | 1.7%(-1.54)#347 | 2.1%(-1.99)#22,205 |
1
Common Questions
What are the Top 10 Zip Codes with the Highest Percentage of Population Employed in Architecture & Engineering in Louisville, KY?
Top 10 Zip Codes with the Highest Percentage of Population Employed in Architecture & Engineering in Louisville, KY are:
What zip code has the Highest Percentage of Population Employed in Architecture & Engineering in Louisville, KY?
40245 has the Highest Percentage of Population Employed in Architecture & Engineering in Louisville, KY with 4.8%.
What is the Percentage of Population Employed in Architecture & Engineering in Louisville, KY?
Percentage of Population Employed in Architecture & Engineering in Louisville is 1.9%.
What is the Percentage of Population Employed in Architecture & Engineering in Kentucky?
Percentage of Population Employed in Architecture & Engineering in Kentucky is 1.7%.
What is the Percentage of Population Employed in Architecture & Engineering in the United States?
Percentage of Population Employed in Architecture & Engineering in the United States is 2.1%.