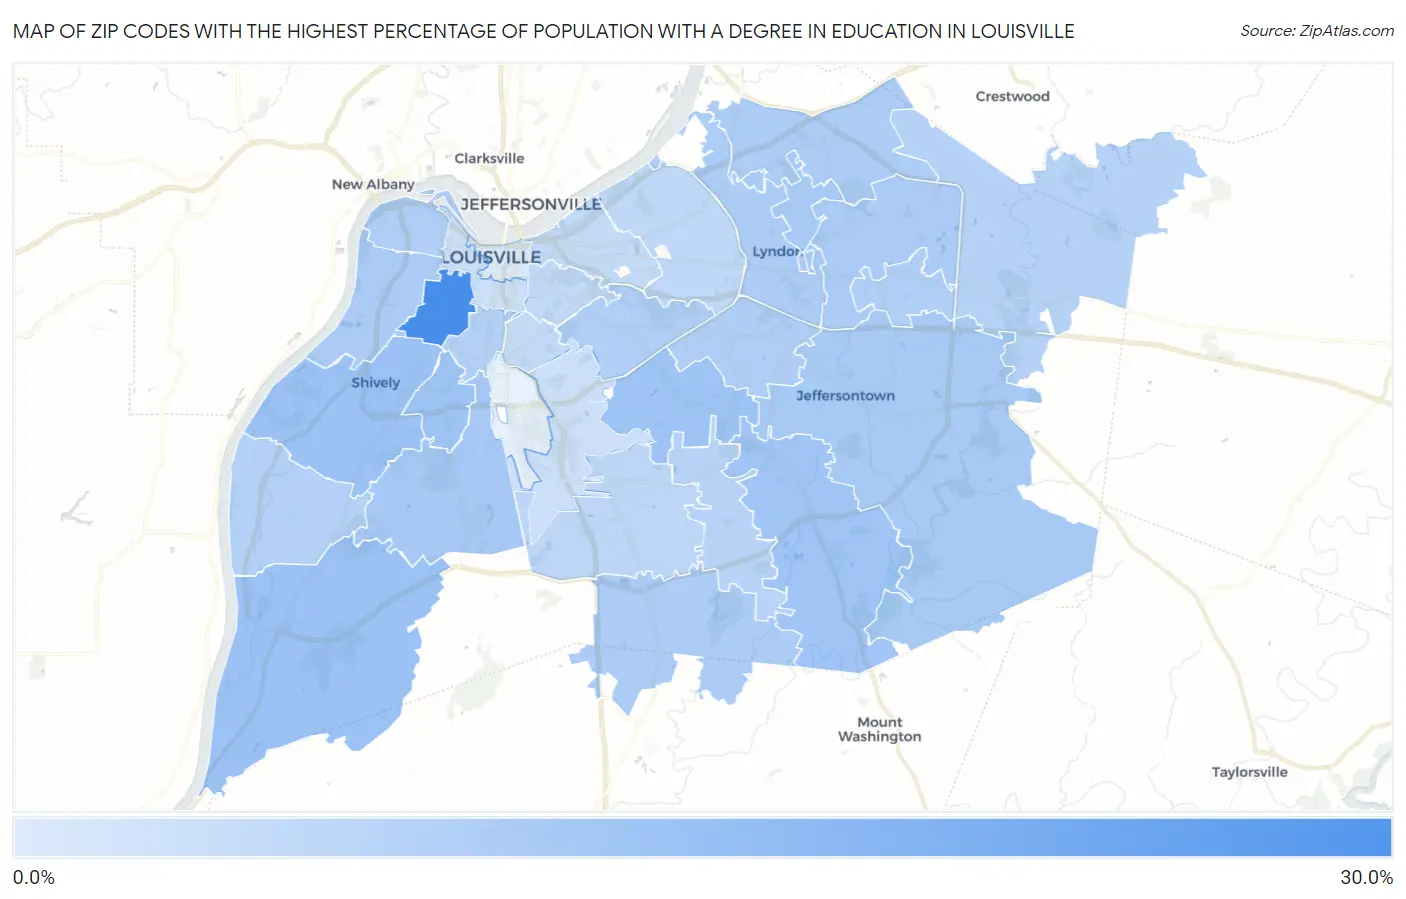
Zip Codes with the Highest Percentage of Population with a Degree in Education in Louisville, KY
RELATED REPORTS & OPTIONS
Education
Louisville
Compare Zip Codes
Map of Zip Codes with the Highest Percentage of Population with a Degree in Education in Louisville
0.0%
30.0%
Zip Codes with the Highest Percentage of Population with a Degree in Education in Louisville, KY
| Zip Code | % Graduates | vs State | vs National | |
| 1. | 40210 | 28.3% | 15.0%(+13.4)#199 | 11.1%(+17.3)#5,193 |
| 2. | 40216 | 13.6% | 15.0%(-1.41)#443 | 11.1%(+2.50)#17,563 |
| 3. | 40272 | 12.9% | 15.0%(-2.07)#453 | 11.1%(+1.84)#18,389 |
| 4. | 40218 | 12.6% | 15.0%(-2.34)#461 | 11.1%(+1.57)#18,727 |
| 5. | 40215 | 12.6% | 15.0%(-2.36)#462 | 11.1%(+1.55)#18,749 |
| 6. | 40291 | 12.1% | 15.0%(-2.82)#478 | 11.1%(+1.09)#19,403 |
| 7. | 40214 | 11.7% | 15.0%(-3.29)#488 | 11.1%(+0.613)#20,066 |
| 8. | 40299 | 11.3% | 15.0%(-3.69)#500 | 11.1%(+0.218)#20,581 |
| 9. | 40242 | 11.2% | 15.0%(-3.73)#502 | 11.1%(+0.174)#20,652 |
| 10. | 40223 | 10.9% | 15.0%(-4.08)#509 | 11.1%(-0.170)#21,119 |
| 11. | 40211 | 10.7% | 15.0%(-4.23)#511 | 11.1%(-0.325)#21,314 |
| 12. | 40222 | 10.5% | 15.0%(-4.43)#518 | 11.1%(-0.520)#21,596 |
| 13. | 40241 | 10.5% | 15.0%(-4.48)#520 | 11.1%(-0.571)#21,668 |
| 14. | 40229 | 10.4% | 15.0%(-4.61)#524 | 11.1%(-0.699)#21,839 |
| 15. | 40220 | 10.0% | 15.0%(-4.95)#529 | 11.1%(-1.05)#22,310 |
| 16. | 40212 | 9.9% | 15.0%(-5.06)#533 | 11.1%(-1.15)#22,490 |
| 17. | 40243 | 9.7% | 15.0%(-5.31)#536 | 11.1%(-1.40)#22,789 |
| 18. | 40205 | 9.5% | 15.0%(-5.48)#538 | 11.1%(-1.57)#23,038 |
| 19. | 40258 | 9.2% | 15.0%(-5.73)#543 | 11.1%(-1.82)#23,371 |
| 20. | 40208 | 9.2% | 15.0%(-5.82)#544 | 11.1%(-1.91)#23,483 |
| 21. | 40245 | 9.0% | 15.0%(-5.99)#546 | 11.1%(-2.08)#23,719 |
| 22. | 40228 | 8.3% | 15.0%(-6.62)#549 | 11.1%(-2.71)#24,453 |
| 23. | 40219 | 7.9% | 15.0%(-7.04)#557 | 11.1%(-3.13)#24,962 |
| 24. | 40207 | 7.2% | 15.0%(-7.73)#564 | 11.1%(-3.83)#25,671 |
| 25. | 40204 | 7.0% | 15.0%(-7.96)#567 | 11.1%(-4.05)#25,920 |
| 26. | 40206 | 6.8% | 15.0%(-8.21)#568 | 11.1%(-4.30)#26,153 |
| 27. | 40217 | 6.5% | 15.0%(-8.42)#571 | 11.1%(-4.51)#26,353 |
| 28. | 40203 | 5.4% | 15.0%(-9.58)#582 | 11.1%(-5.67)#27,284 |
| 29. | 40213 | 5.3% | 15.0%(-9.69)#587 | 11.1%(-5.78)#27,371 |
| 30. | 40202 | 2.7% | 15.0%(-12.2)#600 | 11.1%(-8.32)#28,786 |
1
Common Questions
What are the Top 10 Zip Codes with the Highest Percentage of Population with a Degree in Education in Louisville, KY?
Top 10 Zip Codes with the Highest Percentage of Population with a Degree in Education in Louisville, KY are:
What zip code has the Highest Percentage of Population with a Degree in Education in Louisville, KY?
40210 has the Highest Percentage of Population with a Degree in Education in Louisville, KY with 28.3%.
What is the Percentage of Population with a Degree in Education in Louisville, KY?
Percentage of Population with a Degree in Education in Louisville is 9.8%.
What is the Percentage of Population with a Degree in Education in Kentucky?
Percentage of Population with a Degree in Education in Kentucky is 15.0%.
What is the Percentage of Population with a Degree in Education in the United States?
Percentage of Population with a Degree in Education in the United States is 11.1%.