Zip Codes with the Highest Percentage of Households with Income Above $100,000 in Bowling Green, KY
RELATED REPORTS & OPTIONS
Household Income | $100k+
Bowling Green
Compare Zip Codes
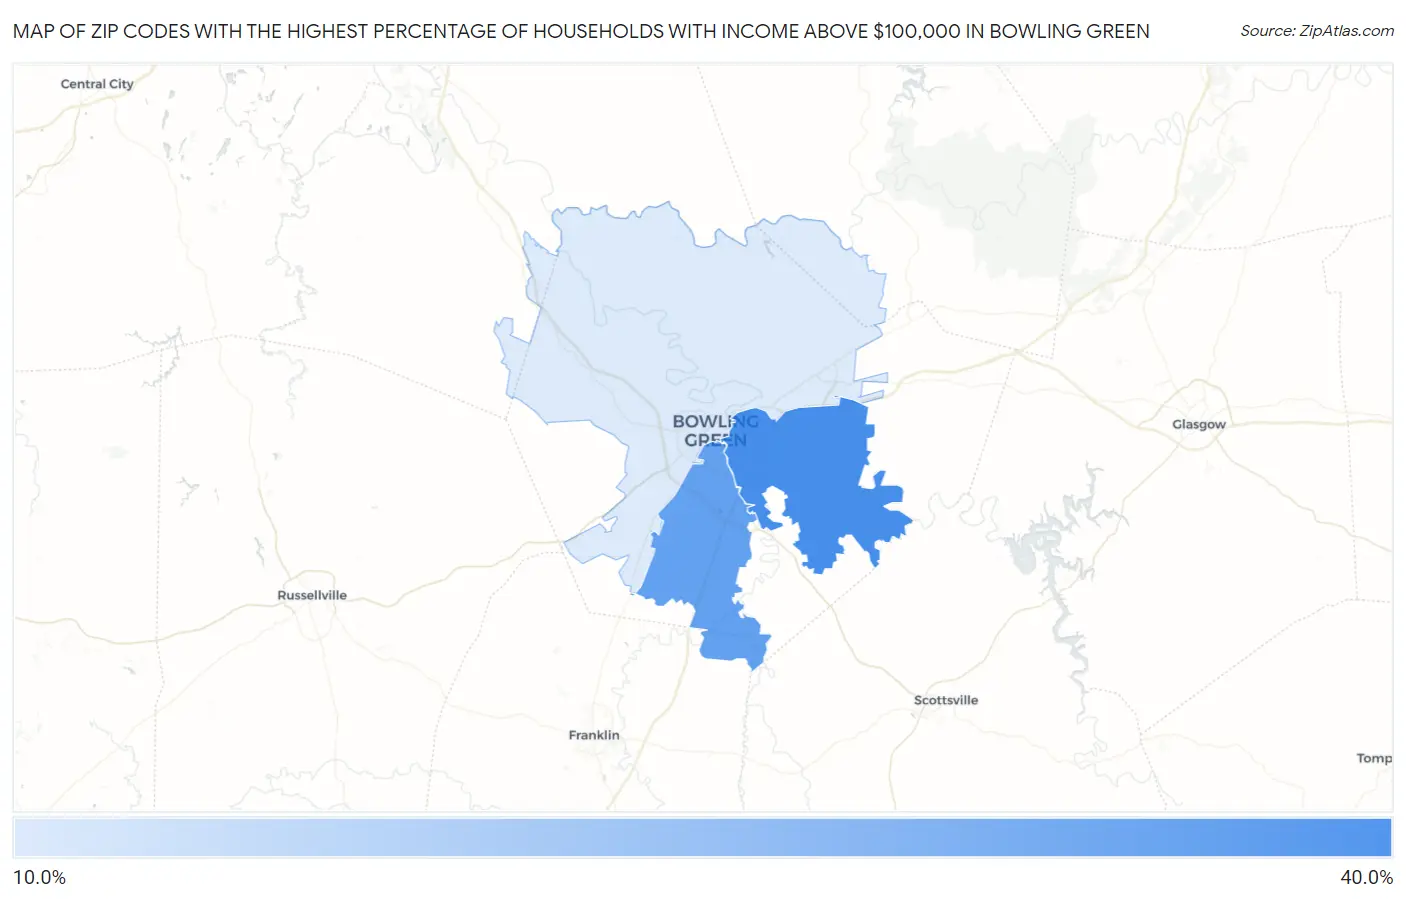
Map of Zip Codes with the Highest Percentage of Households with Income Above $100,000 in Bowling Green
0.0%
40.0%
Zip Codes with the Highest Percentage of Households with Income Above $100,000 in Bowling Green, KY
| Zip Code | Households with Income > $100k | vs State | vs National | |
| 1. | 42103 | 38.2% | 27.5%(+10.7)#78 | 37.3%(+0.900)#9,867 |
| 2. | 42104 | 34.1% | 27.5%(+6.60)#109 | 37.3%(-3.20)#12,327 |
| 3. | 42101 | 16.9% | 27.5%(-10.6)#421 | 37.3%(-20.4)#26,281 |
1
Common Questions
What are the Top Zip Codes with the Highest Percentage of Households with Income Above $100,000 in Bowling Green, KY?
Top Zip Codes with the Highest Percentage of Households with Income Above $100,000 in Bowling Green, KY are:
What zip code has the Highest Percentage of Households with Income Above $100,000 in Bowling Green, KY?
42103 has the Highest Percentage of Households with Income Above $100,000 in Bowling Green, KY with 38.2%.
What is the Percentage of Households with Income Above $100,000 in Bowling Green, KY?
Percentage of Households with Income Above $100,000 in Bowling Green is 19.9%.
What is the Percentage of Households with Income Above $100,000 in Kentucky?
Percentage of Households with Income Above $100,000 in Kentucky is 27.5%.
What is the Percentage of Households with Income Above $100,000 in the United States?
Percentage of Households with Income Above $100,000 in the United States is 37.3%.