Zip Codes with the Highest Percentage of Households with Income Above $100,000 in Virginia
RELATED REPORTS & OPTIONS
Household Income | $100k+
Virginia
Compare Zip Codes
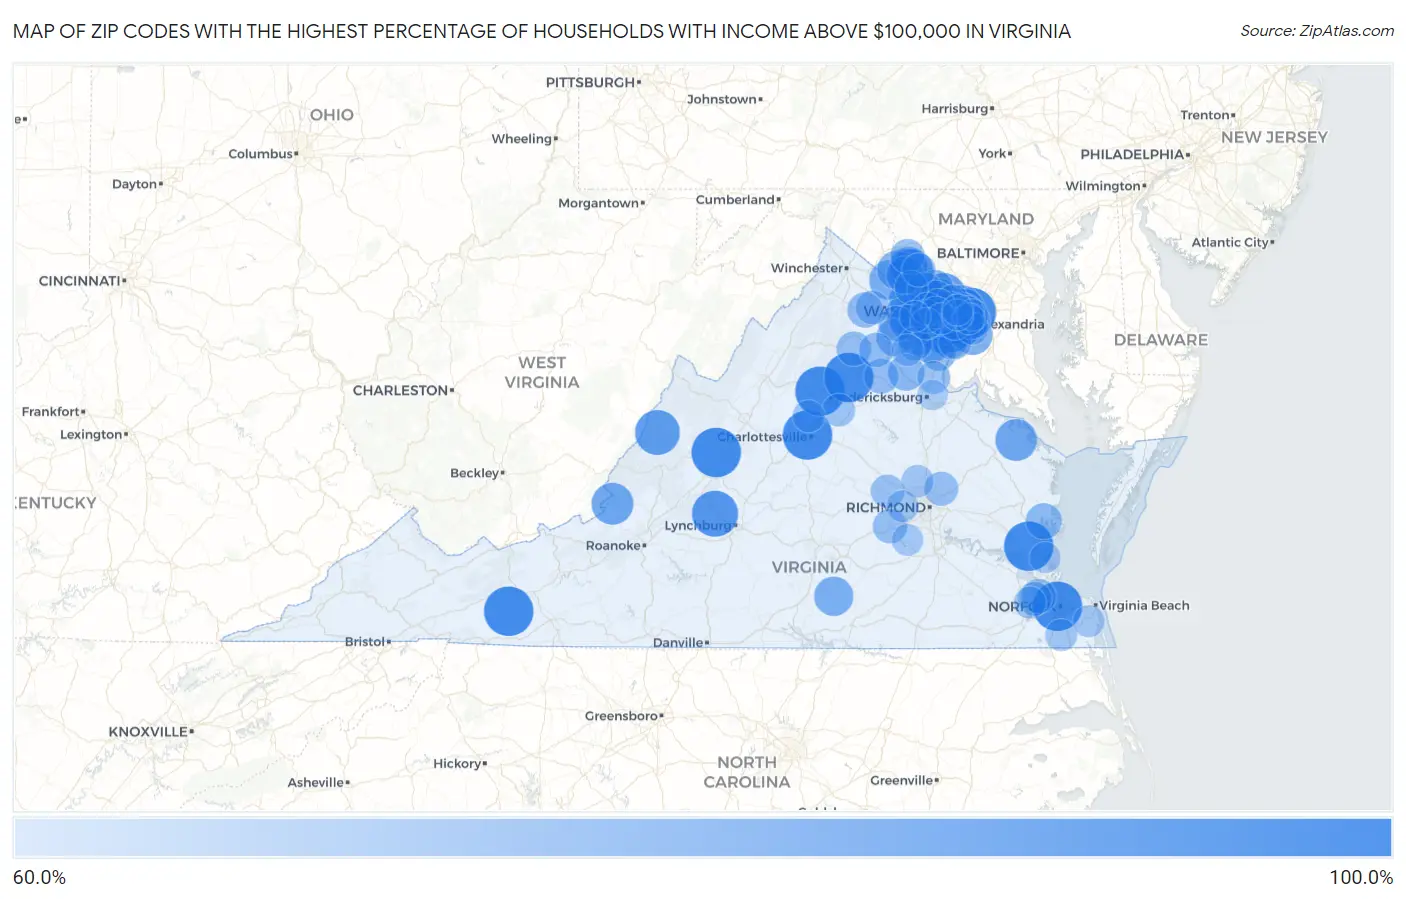
Map of Zip Codes with the Highest Percentage of Households with Income Above $100,000 in Virginia
0.0%
100.0%
Zip Codes with the Highest Percentage of Households with Income Above $100,000 in Virginia
| Zip Code | Households with Income > $100k | vs State | vs National | |
| 1. | 22904 | 100.0% | 44.1%(+55.9)#1 | 37.3%(+62.7)#3 |
| 2. | 22211 | 100.0% | 44.1%(+55.9)#2 | 37.3%(+62.7)#10 |
| 3. | 23691 | 100.0% | 44.1%(+55.9)#3 | 37.3%(+62.7)#12 |
| 4. | 23708 | 100.0% | 44.1%(+55.9)#4 | 37.3%(+62.7)#13 |
| 5. | 22723 | 100.0% | 44.1%(+55.9)#5 | 37.3%(+62.7)#84 |
| 6. | 24415 | 100.0% | 44.1%(+55.9)#6 | 37.3%(+62.7)#99 |
| 7. | 22725 | 100.0% | 44.1%(+55.9)#7 | 37.3%(+62.7)#109 |
| 8. | 24322 | 100.0% | 44.1%(+55.9)#8 | 37.3%(+62.7)#141 |
| 9. | 24536 | 93.1% | 44.1%(+49.0)#9 | 37.3%(+55.8)#160 |
| 10. | 22027 | 91.2% | 44.1%(+47.1)#10 | 37.3%(+53.9)#166 |
| 11. | 22039 | 90.8% | 44.1%(+46.7)#11 | 37.3%(+53.5)#169 |
| 12. | 24412 | 90.4% | 44.1%(+46.3)#12 | 37.3%(+53.1)#173 |
| 13. | 20129 | 89.0% | 44.1%(+44.9)#13 | 37.3%(+51.7)#183 |
| 14. | 22066 | 88.4% | 44.1%(+44.3)#14 | 37.3%(+51.1)#190 |
| 15. | 20148 | 86.3% | 44.1%(+42.2)#15 | 37.3%(+49.0)#209 |
| 16. | 20105 | 85.6% | 44.1%(+41.5)#16 | 37.3%(+48.3)#220 |
| 17. | 24131 | 84.4% | 44.1%(+40.3)#17 | 37.3%(+47.1)#238 |
| 18. | 22529 | 84.2% | 44.1%(+40.1)#18 | 37.3%(+46.9)#242 |
| 19. | 20124 | 82.4% | 44.1%(+38.3)#19 | 37.3%(+45.1)#271 |
| 20. | 20152 | 81.4% | 44.1%(+37.3)#20 | 37.3%(+44.1)#295 |
| 21. | 22124 | 81.4% | 44.1%(+37.3)#21 | 37.3%(+44.1)#297 |
| 22. | 22308 | 80.9% | 44.1%(+36.8)#22 | 37.3%(+43.6)#314 |
| 23. | 20136 | 80.8% | 44.1%(+36.7)#23 | 37.3%(+43.5)#318 |
| 24. | 20169 | 80.8% | 44.1%(+36.7)#24 | 37.3%(+43.5)#319 |
| 25. | 22101 | 80.6% | 44.1%(+36.5)#25 | 37.3%(+43.3)#324 |
| 26. | 22207 | 80.0% | 44.1%(+35.9)#26 | 37.3%(+42.7)#340 |
| 27. | 22181 | 79.9% | 44.1%(+35.8)#27 | 37.3%(+42.6)#347 |
| 28. | 20141 | 79.3% | 44.1%(+35.2)#28 | 37.3%(+42.0)#368 |
| 29. | 23952 | 79.2% | 44.1%(+35.1)#29 | 37.3%(+41.9)#376 |
| 30. | 20112 | 79.1% | 44.1%(+35.0)#30 | 37.3%(+41.8)#378 |
| 31. | 22205 | 78.5% | 44.1%(+34.4)#31 | 37.3%(+41.2)#399 |
| 32. | 22153 | 78.3% | 44.1%(+34.2)#32 | 37.3%(+41.0)#406 |
| 33. | 22182 | 77.5% | 44.1%(+33.4)#33 | 37.3%(+40.2)#442 |
| 34. | 20132 | 77.2% | 44.1%(+33.1)#34 | 37.3%(+39.9)#456 |
| 35. | 20197 | 77.1% | 44.1%(+33.0)#35 | 37.3%(+39.8)#466 |
| 36. | 20194 | 76.7% | 44.1%(+32.6)#36 | 37.3%(+39.4)#480 |
| 37. | 22213 | 76.7% | 44.1%(+32.6)#37 | 37.3%(+39.4)#483 |
| 38. | 22032 | 76.6% | 44.1%(+32.5)#38 | 37.3%(+39.3)#488 |
| 39. | 20158 | 75.9% | 44.1%(+31.8)#39 | 37.3%(+38.6)#526 |
| 40. | 20165 | 75.5% | 44.1%(+31.4)#40 | 37.3%(+38.2)#547 |
| 41. | 20187 | 75.3% | 44.1%(+31.2)#41 | 37.3%(+38.0)#560 |
| 42. | 22015 | 74.5% | 44.1%(+30.4)#42 | 37.3%(+37.2)#604 |
| 43. | 22180 | 74.3% | 44.1%(+30.2)#43 | 37.3%(+37.0)#616 |
| 44. | 22720 | 74.0% | 44.1%(+29.9)#44 | 37.3%(+36.7)#638 |
| 45. | 23128 | 73.0% | 44.1%(+28.9)#45 | 37.3%(+35.7)#706 |
| 46. | 22310 | 72.5% | 44.1%(+28.4)#46 | 37.3%(+35.2)#736 |
| 47. | 22152 | 72.3% | 44.1%(+28.2)#47 | 37.3%(+35.0)#752 |
| 48. | 20155 | 71.9% | 44.1%(+27.8)#48 | 37.3%(+34.6)#780 |
| 49. | 20137 | 71.9% | 44.1%(+27.8)#49 | 37.3%(+34.6)#786 |
| 50. | 20171 | 71.7% | 44.1%(+27.6)#50 | 37.3%(+34.4)#800 |
| 51. | 22301 | 71.6% | 44.1%(+27.5)#51 | 37.3%(+34.3)#814 |
| 52. | 22643 | 71.6% | 44.1%(+27.5)#52 | 37.3%(+34.3)#819 |
| 53. | 22315 | 71.4% | 44.1%(+27.3)#53 | 37.3%(+34.1)#831 |
| 54. | 22125 | 70.9% | 44.1%(+26.8)#54 | 37.3%(+33.6)#887 |
| 55. | 20147 | 70.7% | 44.1%(+26.6)#55 | 37.3%(+33.4)#892 |
| 56. | 22741 | 70.4% | 44.1%(+26.3)#56 | 37.3%(+33.1)#928 |
| 57. | 23433 | 70.0% | 44.1%(+25.9)#57 | 37.3%(+32.7)#969 |
| 58. | 22716 | 70.0% | 44.1%(+25.9)#58 | 37.3%(+32.7)#970 |
| 59. | 22724 | 69.9% | 44.1%(+25.8)#59 | 37.3%(+32.6)#980 |
| 60. | 20180 | 69.8% | 44.1%(+25.7)#60 | 37.3%(+32.5)#989 |
| 61. | 23120 | 69.7% | 44.1%(+25.6)#61 | 37.3%(+32.4)#995 |
| 62. | 22046 | 69.2% | 44.1%(+25.1)#62 | 37.3%(+31.9)#1,039 |
| 63. | 23116 | 69.0% | 44.1%(+24.9)#63 | 37.3%(+31.7)#1,054 |
| 64. | 22025 | 69.0% | 44.1%(+24.9)#64 | 37.3%(+31.7)#1,056 |
| 65. | 20170 | 68.7% | 44.1%(+24.6)#65 | 37.3%(+31.4)#1,080 |
| 66. | 20144 | 68.6% | 44.1%(+24.5)#66 | 37.3%(+31.3)#1,104 |
| 67. | 20181 | 68.3% | 44.1%(+24.2)#67 | 37.3%(+31.0)#1,131 |
| 68. | 23436 | 68.2% | 44.1%(+24.1)#68 | 37.3%(+30.9)#1,143 |
| 69. | 20175 | 68.0% | 44.1%(+23.9)#69 | 37.3%(+30.7)#1,159 |
| 70. | 20176 | 67.9% | 44.1%(+23.8)#70 | 37.3%(+30.6)#1,172 |
| 71. | 22314 | 67.9% | 44.1%(+23.8)#71 | 37.3%(+30.6)#1,173 |
| 72. | 23039 | 67.6% | 44.1%(+23.5)#72 | 37.3%(+30.3)#1,216 |
| 73. | 20120 | 67.5% | 44.1%(+23.4)#73 | 37.3%(+30.2)#1,219 |
| 74. | 22102 | 67.5% | 44.1%(+23.4)#74 | 37.3%(+30.2)#1,221 |
| 75. | 22554 | 66.9% | 44.1%(+22.8)#75 | 37.3%(+29.6)#1,269 |
| 76. | 22201 | 66.9% | 44.1%(+22.8)#76 | 37.3%(+29.6)#1,273 |
| 77. | 22079 | 66.7% | 44.1%(+22.6)#77 | 37.3%(+29.4)#1,303 |
| 78. | 22972 | 66.7% | 44.1%(+22.6)#78 | 37.3%(+29.4)#1,315 |
| 79. | 20151 | 65.9% | 44.1%(+21.8)#79 | 37.3%(+28.6)#1,408 |
| 80. | 23059 | 65.8% | 44.1%(+21.7)#80 | 37.3%(+28.5)#1,416 |
| 81. | 22151 | 65.8% | 44.1%(+21.7)#81 | 37.3%(+28.5)#1,422 |
| 82. | 20191 | 65.7% | 44.1%(+21.6)#82 | 37.3%(+28.4)#1,433 |
| 83. | 22936 | 65.4% | 44.1%(+21.3)#83 | 37.3%(+28.1)#1,485 |
| 84. | 23322 | 65.1% | 44.1%(+21.0)#84 | 37.3%(+27.8)#1,523 |
| 85. | 22307 | 64.9% | 44.1%(+20.8)#85 | 37.3%(+27.6)#1,555 |
| 86. | 20119 | 64.9% | 44.1%(+20.8)#86 | 37.3%(+27.6)#1,557 |
| 87. | 23432 | 64.9% | 44.1%(+20.8)#87 | 37.3%(+27.6)#1,559 |
| 88. | 23456 | 64.6% | 44.1%(+20.5)#88 | 37.3%(+27.3)#1,587 |
| 89. | 22033 | 64.6% | 44.1%(+20.5)#89 | 37.3%(+27.3)#1,589 |
| 90. | 23113 | 64.6% | 44.1%(+20.5)#90 | 37.3%(+27.3)#1,591 |
| 91. | 20121 | 64.4% | 44.1%(+20.3)#91 | 37.3%(+27.1)#1,626 |
| 92. | 22202 | 64.1% | 44.1%(+20.0)#92 | 37.3%(+26.8)#1,663 |
| 93. | 23838 | 64.0% | 44.1%(+19.9)#93 | 37.3%(+26.7)#1,683 |
| 94. | 22206 | 63.7% | 44.1%(+19.6)#94 | 37.3%(+26.4)#1,725 |
| 95. | 22030 | 63.5% | 44.1%(+19.4)#95 | 37.3%(+26.2)#1,749 |
| 96. | 22042 | 63.4% | 44.1%(+19.3)#96 | 37.3%(+26.1)#1,769 |
| 97. | 22043 | 63.4% | 44.1%(+19.3)#97 | 37.3%(+26.1)#1,770 |
| 98. | 20143 | 63.3% | 44.1%(+19.2)#98 | 37.3%(+26.0)#1,800 |
| 99. | 23696 | 63.1% | 44.1%(+19.0)#99 | 37.3%(+25.8)#1,830 |
| 100. | 22405 | 61.7% | 44.1%(+17.6)#100 | 37.3%(+24.4)#2,047 |
Common Questions
What are the Top 10 Zip Codes with the Highest Percentage of Households with Income Above $100,000 in Virginia?
Top 10 Zip Codes with the Highest Percentage of Households with Income Above $100,000 in Virginia are:
What zip code has the Highest Percentage of Households with Income Above $100,000 in Virginia?
22904 has the Highest Percentage of Households with Income Above $100,000 in Virginia with 100.0%.
What is the Percentage of Households with Income Above $100,000 in the State of Virginia?
Percentage of Households with Income Above $100,000 in Virginia is 44.1%.
What is the Percentage of Households with Income Above $100,000 in the United States?
Percentage of Households with Income Above $100,000 in the United States is 37.3%.