Zip Codes with the Highest Percentage of Population with a Degree in Engineering in Bowling Green, KY
RELATED REPORTS & OPTIONS
Engineering
Bowling Green
Compare Zip Codes
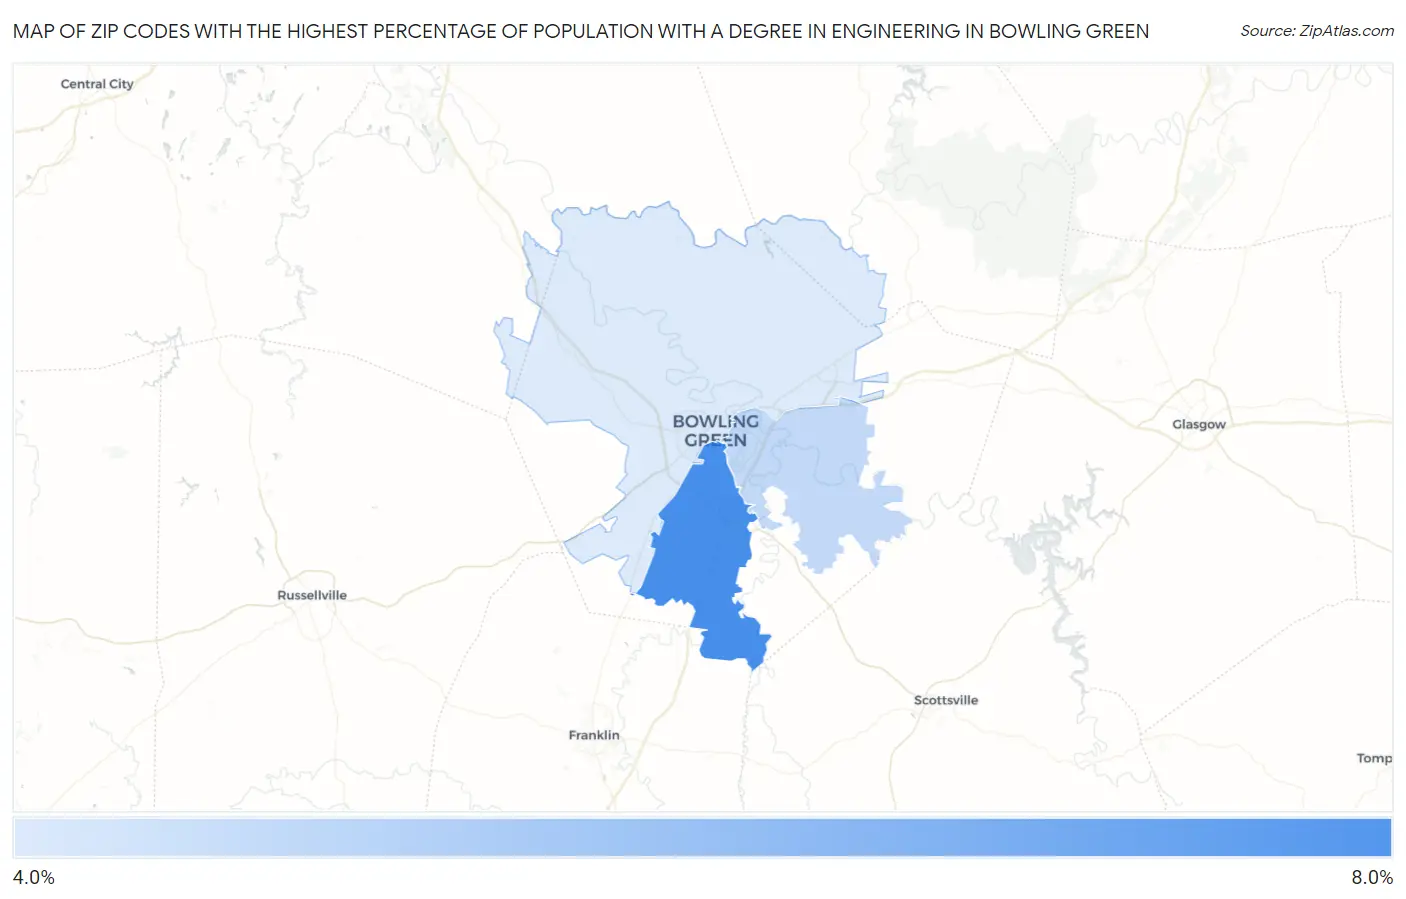
Map of Zip Codes with the Highest Percentage of Population with a Degree in Engineering in Bowling Green
0.0%
8.0%
Zip Codes with the Highest Percentage of Population with a Degree in Engineering in Bowling Green, KY
| Zip Code | % Graduates | vs State | vs National | |
| 1. | 42104 | 7.1% | 5.5%(+1.55)#105 | 7.6%(-0.568)#8,814 |
| 2. | 42103 | 4.9% | 5.5%(-0.674)#178 | 7.6%(-2.79)#14,118 |
| 3. | 42101 | 4.4% | 5.5%(-1.17)#199 | 7.6%(-3.29)#15,436 |
1
Common Questions
What are the Top Zip Codes with the Highest Percentage of Population with a Degree in Engineering in Bowling Green, KY?
Top Zip Codes with the Highest Percentage of Population with a Degree in Engineering in Bowling Green, KY are:
What zip code has the Highest Percentage of Population with a Degree in Engineering in Bowling Green, KY?
42104 has the Highest Percentage of Population with a Degree in Engineering in Bowling Green, KY with 7.1%.
What is the Percentage of Population with a Degree in Engineering in Bowling Green, KY?
Percentage of Population with a Degree in Engineering in Bowling Green is 5.4%.
What is the Percentage of Population with a Degree in Engineering in Kentucky?
Percentage of Population with a Degree in Engineering in Kentucky is 5.5%.
What is the Percentage of Population with a Degree in Engineering in the United States?
Percentage of Population with a Degree in Engineering in the United States is 7.6%.