Zip Codes with the Highest Percentage of Households with Income Above $100,000 in Florida
RELATED REPORTS & OPTIONS
Household Income | $100k+
Florida
Compare Zip Codes
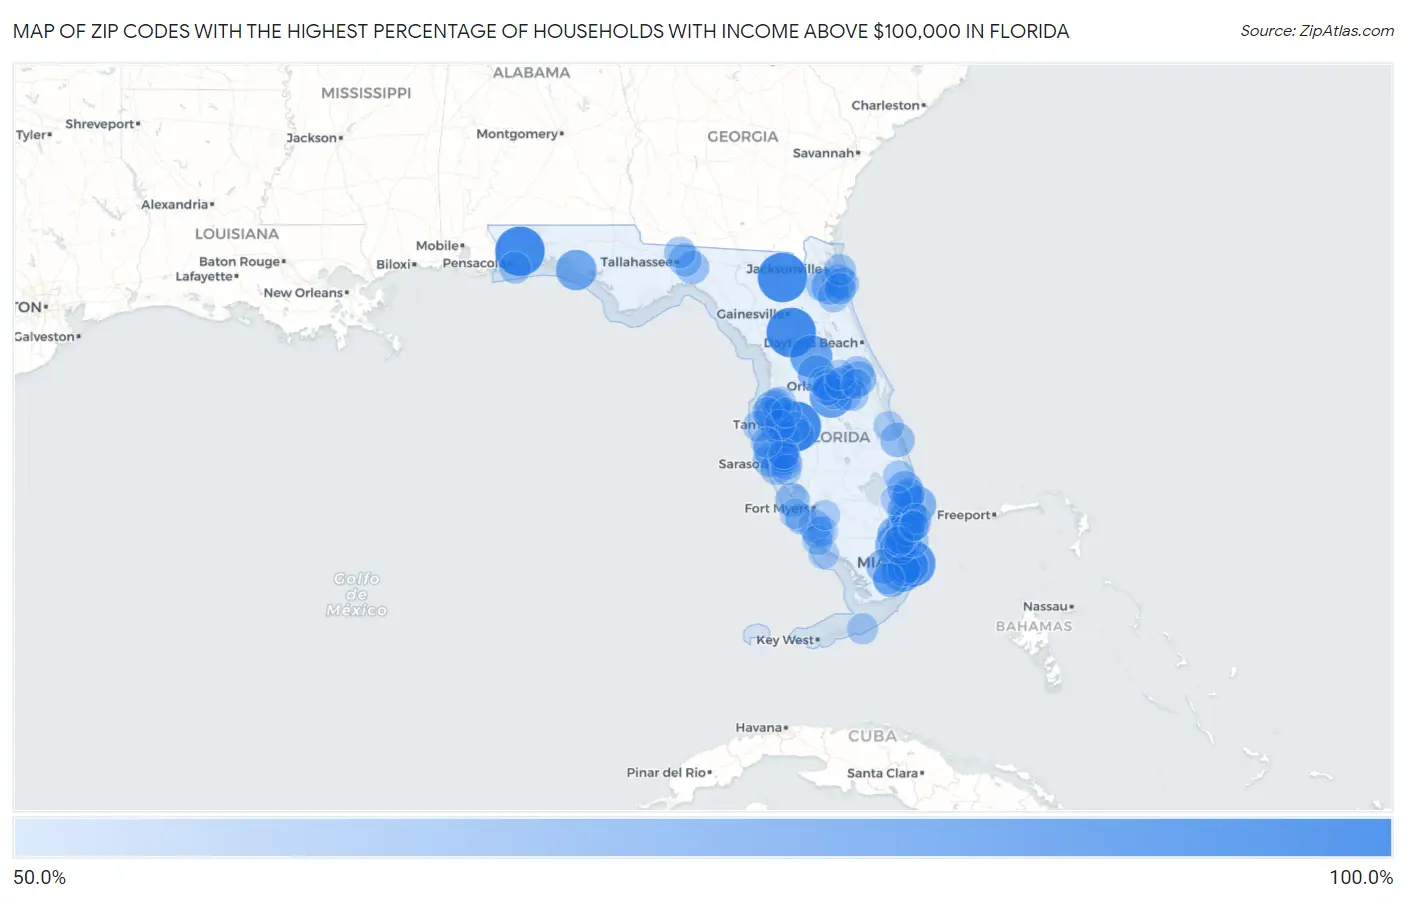
Map of Zip Codes with the Highest Percentage of Households with Income Above $100,000 in Florida
0.0%
100.0%
Zip Codes with the Highest Percentage of Households with Income Above $100,000 in Florida
| Zip Code | Households with Income > $100k | vs State | vs National | |
| 1. | 32530 | 100.0% | 32.4%(+67.6)#1 | 37.3%(+62.7)#92 |
| 2. | 32072 | 100.0% | 32.4%(+67.6)#2 | 37.3%(+62.7)#97 |
| 3. | 32634 | 100.0% | 32.4%(+67.6)#3 | 37.3%(+62.7)#126 |
| 4. | 33530 | 100.0% | 32.4%(+67.6)#4 | 37.3%(+62.7)#128 |
| 5. | 33109 | 90.8% | 32.4%(+58.4)#5 | 37.3%(+53.5)#170 |
| 6. | 32830 | 84.0% | 32.4%(+51.6)#6 | 37.3%(+46.7)#246 |
| 7. | 32133 | 81.6% | 32.4%(+49.2)#7 | 37.3%(+44.3)#291 |
| 8. | 33158 | 79.2% | 32.4%(+46.8)#8 | 37.3%(+41.9)#373 |
| 9. | 32461 | 77.6% | 32.4%(+45.2)#9 | 37.3%(+40.3)#437 |
| 10. | 33332 | 74.9% | 32.4%(+42.5)#10 | 37.3%(+37.6)#580 |
| 11. | 33076 | 72.0% | 32.4%(+39.6)#11 | 37.3%(+34.7)#770 |
| 12. | 33327 | 70.6% | 32.4%(+38.2)#12 | 37.3%(+33.3)#904 |
| 13. | 34250 | 70.4% | 32.4%(+38.0)#13 | 37.3%(+33.1)#927 |
| 14. | 33449 | 70.3% | 32.4%(+37.9)#14 | 37.3%(+33.0)#936 |
| 15. | 33480 | 69.7% | 32.4%(+37.3)#15 | 37.3%(+32.4)#997 |
| 16. | 33473 | 69.2% | 32.4%(+36.8)#16 | 37.3%(+31.9)#1,040 |
| 17. | 34797 | 68.7% | 32.4%(+36.3)#17 | 37.3%(+31.4)#1,088 |
| 18. | 33330 | 68.2% | 32.4%(+35.8)#18 | 37.3%(+30.9)#1,140 |
| 19. | 33031 | 68.2% | 32.4%(+35.8)#19 | 37.3%(+30.9)#1,141 |
| 20. | 32259 | 67.6% | 32.4%(+35.2)#20 | 37.3%(+30.3)#1,207 |
| 21. | 33331 | 67.2% | 32.4%(+34.8)#21 | 37.3%(+29.9)#1,243 |
| 22. | 33556 | 66.9% | 32.4%(+34.5)#22 | 37.3%(+29.6)#1,276 |
| 23. | 33029 | 66.2% | 32.4%(+33.8)#23 | 37.3%(+28.9)#1,373 |
| 24. | 32814 | 65.5% | 32.4%(+33.1)#24 | 37.3%(+28.2)#1,467 |
| 25. | 33131 | 65.0% | 32.4%(+32.6)#25 | 37.3%(+27.7)#1,537 |
| 26. | 34201 | 64.6% | 32.4%(+32.2)#26 | 37.3%(+27.3)#1,597 |
| 27. | 33478 | 64.5% | 32.4%(+32.1)#27 | 37.3%(+27.2)#1,614 |
| 28. | 33146 | 64.0% | 32.4%(+31.6)#28 | 37.3%(+26.7)#1,679 |
| 29. | 33194 | 64.0% | 32.4%(+31.6)#29 | 37.3%(+26.7)#1,685 |
| 30. | 32766 | 63.6% | 32.4%(+31.2)#30 | 37.3%(+26.3)#1,739 |
| 31. | 33149 | 63.3% | 32.4%(+30.9)#31 | 37.3%(+26.0)#1,795 |
| 32. | 33629 | 63.2% | 32.4%(+30.8)#32 | 37.3%(+25.9)#1,808 |
| 33. | 32963 | 62.1% | 32.4%(+29.7)#33 | 37.3%(+24.8)#1,987 |
| 34. | 34228 | 61.9% | 32.4%(+29.5)#34 | 37.3%(+24.6)#2,021 |
| 35. | 33921 | 61.8% | 32.4%(+29.4)#35 | 37.3%(+24.5)#2,044 |
| 36. | 32081 | 61.2% | 32.4%(+28.8)#36 | 37.3%(+23.9)#2,137 |
| 37. | 33498 | 60.4% | 32.4%(+28.0)#37 | 37.3%(+23.1)#2,288 |
| 38. | 33626 | 59.9% | 32.4%(+27.5)#38 | 37.3%(+22.6)#2,383 |
| 39. | 32361 | 59.9% | 32.4%(+27.5)#39 | 37.3%(+22.6)#2,401 |
| 40. | 33412 | 59.5% | 32.4%(+27.1)#40 | 37.3%(+22.2)#2,468 |
| 41. | 32317 | 59.3% | 32.4%(+26.9)#41 | 37.3%(+22.0)#2,504 |
| 42. | 33328 | 59.2% | 32.4%(+26.8)#42 | 37.3%(+21.9)#2,521 |
| 43. | 33547 | 59.1% | 32.4%(+26.7)#43 | 37.3%(+21.8)#2,541 |
| 44. | 33548 | 59.0% | 32.4%(+26.6)#44 | 37.3%(+21.7)#2,569 |
| 45. | 34786 | 58.9% | 32.4%(+26.5)#45 | 37.3%(+21.6)#2,581 |
| 46. | 33028 | 58.7% | 32.4%(+26.3)#46 | 37.3%(+21.4)#2,621 |
| 47. | 32003 | 58.4% | 32.4%(+26.0)#47 | 37.3%(+21.1)#2,684 |
| 48. | 32082 | 58.3% | 32.4%(+25.9)#48 | 37.3%(+21.0)#2,703 |
| 49. | 33156 | 58.2% | 32.4%(+25.8)#49 | 37.3%(+20.9)#2,723 |
| 50. | 32732 | 58.1% | 32.4%(+25.7)#50 | 37.3%(+20.8)#2,748 |
| 51. | 34134 | 58.0% | 32.4%(+25.6)#51 | 37.3%(+20.7)#2,762 |
| 52. | 33418 | 57.5% | 32.4%(+25.1)#52 | 37.3%(+20.2)#2,867 |
| 53. | 33301 | 57.4% | 32.4%(+25.0)#53 | 37.3%(+20.1)#2,892 |
| 54. | 32092 | 57.0% | 32.4%(+24.6)#54 | 37.3%(+19.7)#2,973 |
| 55. | 32561 | 57.0% | 32.4%(+24.6)#55 | 37.3%(+19.7)#2,983 |
| 56. | 34242 | 57.0% | 32.4%(+24.6)#56 | 37.3%(+19.7)#2,986 |
| 57. | 34202 | 56.8% | 32.4%(+24.4)#57 | 37.3%(+19.5)#3,022 |
| 58. | 33572 | 56.7% | 32.4%(+24.3)#58 | 37.3%(+19.4)#3,047 |
| 59. | 34240 | 56.6% | 32.4%(+24.2)#59 | 37.3%(+19.3)#3,074 |
| 60. | 33067 | 56.3% | 32.4%(+23.9)#60 | 37.3%(+19.0)#3,130 |
| 61. | 32832 | 56.2% | 32.4%(+23.8)#61 | 37.3%(+18.9)#3,150 |
| 62. | 32266 | 56.0% | 32.4%(+23.6)#62 | 37.3%(+18.7)#3,194 |
| 63. | 34211 | 55.8% | 32.4%(+23.4)#63 | 37.3%(+18.5)#3,245 |
| 64. | 32312 | 55.7% | 32.4%(+23.3)#64 | 37.3%(+18.4)#3,270 |
| 65. | 32095 | 55.6% | 32.4%(+23.2)#65 | 37.3%(+18.3)#3,294 |
| 66. | 34637 | 55.6% | 32.4%(+23.2)#66 | 37.3%(+18.3)#3,299 |
| 67. | 34990 | 55.2% | 32.4%(+22.8)#67 | 37.3%(+17.9)#3,394 |
| 68. | 33596 | 55.2% | 32.4%(+22.8)#68 | 37.3%(+17.9)#3,395 |
| 69. | 34756 | 55.2% | 32.4%(+22.8)#69 | 37.3%(+17.9)#3,407 |
| 70. | 33323 | 55.1% | 32.4%(+22.7)#70 | 37.3%(+17.8)#3,426 |
| 71. | 34108 | 55.1% | 32.4%(+22.7)#71 | 37.3%(+17.8)#3,431 |
| 72. | 33786 | 55.1% | 32.4%(+22.7)#72 | 37.3%(+17.8)#3,442 |
| 73. | 32827 | 54.9% | 32.4%(+22.5)#73 | 37.3%(+17.6)#3,479 |
| 74. | 34638 | 54.8% | 32.4%(+22.4)#74 | 37.3%(+17.5)#3,499 |
| 75. | 32836 | 54.5% | 32.4%(+22.1)#75 | 37.3%(+17.2)#3,577 |
| 76. | 33187 | 54.5% | 32.4%(+22.1)#76 | 37.3%(+17.2)#3,581 |
| 77. | 34760 | 54.5% | 32.4%(+22.1)#77 | 37.3%(+17.2)#3,595 |
| 78. | 33957 | 54.4% | 32.4%(+22.0)#78 | 37.3%(+17.1)#3,617 |
| 79. | 33051 | 54.3% | 32.4%(+21.9)#79 | 37.3%(+17.0)#3,656 |
| 80. | 34787 | 54.1% | 32.4%(+21.7)#80 | 37.3%(+16.8)#3,681 |
| 81. | 33431 | 54.1% | 32.4%(+21.7)#81 | 37.3%(+16.8)#3,689 |
| 82. | 32804 | 53.9% | 32.4%(+21.5)#82 | 37.3%(+16.6)#3,744 |
| 83. | 34241 | 53.6% | 32.4%(+21.2)#83 | 37.3%(+16.3)#3,809 |
| 84. | 34688 | 53.6% | 32.4%(+21.2)#84 | 37.3%(+16.3)#3,813 |
| 85. | 33470 | 53.4% | 32.4%(+21.0)#85 | 37.3%(+16.1)#3,853 |
| 86. | 34212 | 53.4% | 32.4%(+21.0)#86 | 37.3%(+16.1)#3,855 |
| 87. | 32779 | 53.3% | 32.4%(+20.9)#87 | 37.3%(+16.0)#3,886 |
| 88. | 34119 | 53.2% | 32.4%(+20.8)#88 | 37.3%(+15.9)#3,918 |
| 89. | 33606 | 53.2% | 32.4%(+20.8)#89 | 37.3%(+15.9)#3,924 |
| 90. | 34145 | 53.0% | 32.4%(+20.6)#90 | 37.3%(+15.7)#3,964 |
| 91. | 33715 | 53.0% | 32.4%(+20.6)#91 | 37.3%(+15.7)#3,969 |
| 92. | 34102 | 52.8% | 32.4%(+20.4)#92 | 37.3%(+15.5)#4,029 |
| 93. | 33483 | 52.6% | 32.4%(+20.2)#93 | 37.3%(+15.3)#4,090 |
| 94. | 33326 | 52.5% | 32.4%(+20.1)#94 | 37.3%(+15.2)#4,108 |
| 95. | 33913 | 52.5% | 32.4%(+20.1)#95 | 37.3%(+15.2)#4,112 |
| 96. | 32949 | 52.5% | 32.4%(+20.1)#96 | 37.3%(+15.2)#4,124 |
| 97. | 33924 | 52.5% | 32.4%(+20.1)#97 | 37.3%(+15.2)#4,130 |
| 98. | 33486 | 52.3% | 32.4%(+19.9)#98 | 37.3%(+15.0)#4,167 |
| 99. | 32820 | 52.3% | 32.4%(+19.9)#99 | 37.3%(+15.0)#4,171 |
| 100. | 33647 | 52.2% | 32.4%(+19.8)#100 | 37.3%(+14.9)#4,184 |
Common Questions
What are the Top 10 Zip Codes with the Highest Percentage of Households with Income Above $100,000 in Florida?
Top 10 Zip Codes with the Highest Percentage of Households with Income Above $100,000 in Florida are:
What zip code has the Highest Percentage of Households with Income Above $100,000 in Florida?
32530 has the Highest Percentage of Households with Income Above $100,000 in Florida with 100.0%.
What is the Percentage of Households with Income Above $100,000 in the State of Florida?
Percentage of Households with Income Above $100,000 in Florida is 32.4%.
What is the Percentage of Households with Income Above $100,000 in the United States?
Percentage of Households with Income Above $100,000 in the United States is 37.3%.