Zip Codes with the Highest Percentage of Households with Income Above $100,000 in Owensboro, KY
RELATED REPORTS & OPTIONS
Household Income | $100k+
Owensboro
Compare Zip Codes
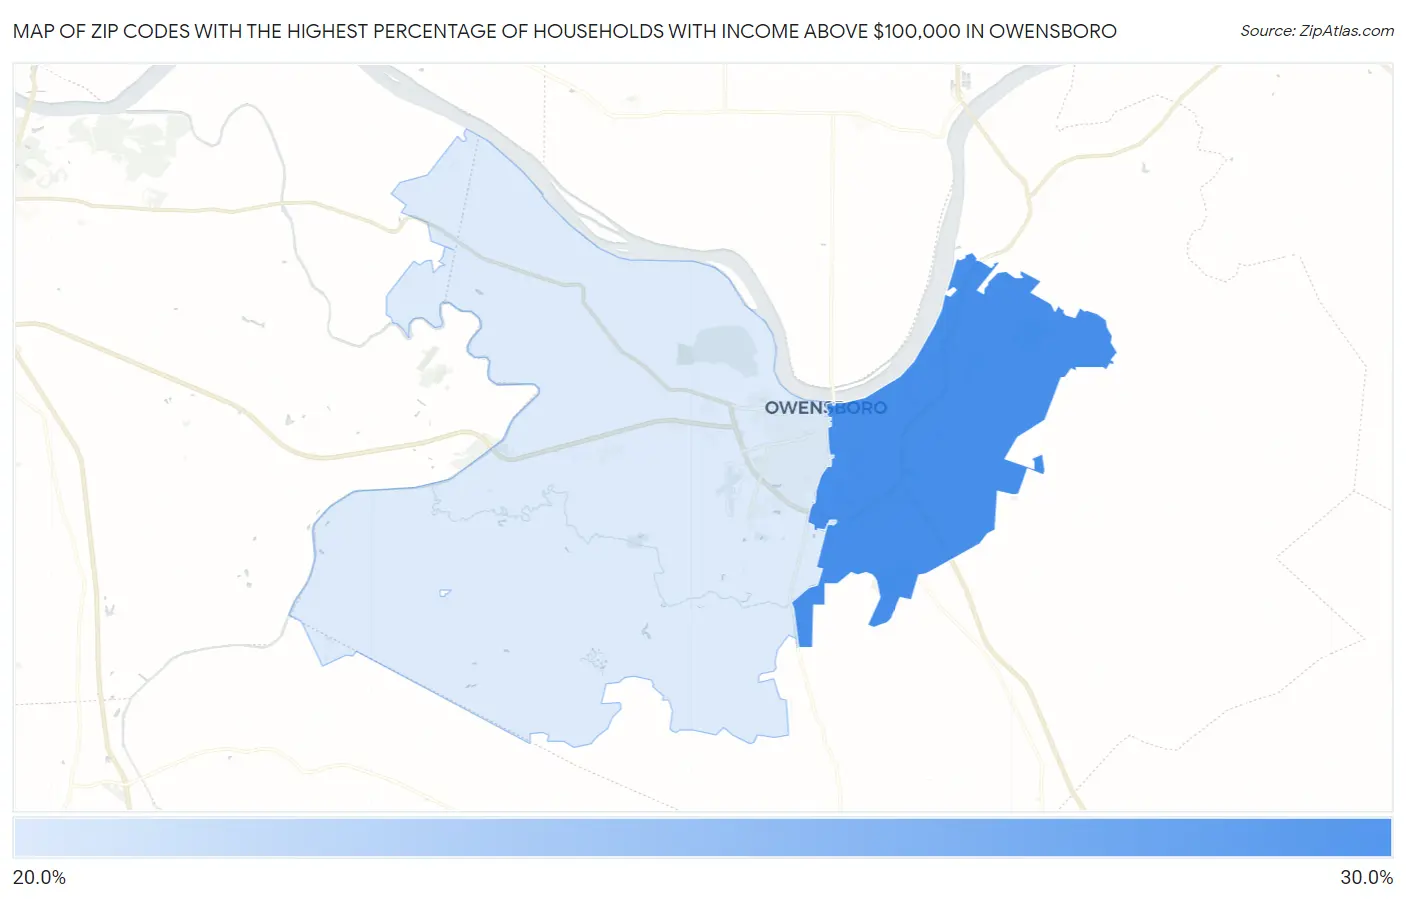
Map of Zip Codes with the Highest Percentage of Households with Income Above $100,000 in Owensboro
0.0%
30.0%
Zip Codes with the Highest Percentage of Households with Income Above $100,000 in Owensboro, KY
| Zip Code | Households with Income > $100k | vs State | vs National | |
| 1. | 42303 | 28.9% | 27.5%(+1.40)#173 | 37.3%(-8.40)#16,309 |
| 2. | 42301 | 27.0% | 27.5%(-0.500)#201 | 37.3%(-10.3)#17,980 |
1
Common Questions
What are the Top Zip Codes with the Highest Percentage of Households with Income Above $100,000 in Owensboro, KY?
Top Zip Codes with the Highest Percentage of Households with Income Above $100,000 in Owensboro, KY are:
What zip code has the Highest Percentage of Households with Income Above $100,000 in Owensboro, KY?
42303 has the Highest Percentage of Households with Income Above $100,000 in Owensboro, KY with 28.9%.
What is the Percentage of Households with Income Above $100,000 in Owensboro, KY?
Percentage of Households with Income Above $100,000 in Owensboro is 23.2%.
What is the Percentage of Households with Income Above $100,000 in Kentucky?
Percentage of Households with Income Above $100,000 in Kentucky is 27.5%.
What is the Percentage of Households with Income Above $100,000 in the United States?
Percentage of Households with Income Above $100,000 in the United States is 37.3%.