Zip Codes with the Highest Percentage of Population Taking Taxi / Cab to Work in Bowling Green, KY
RELATED REPORTS & OPTIONS
Taxi / Cab
Bowling Green
Compare Zip Codes
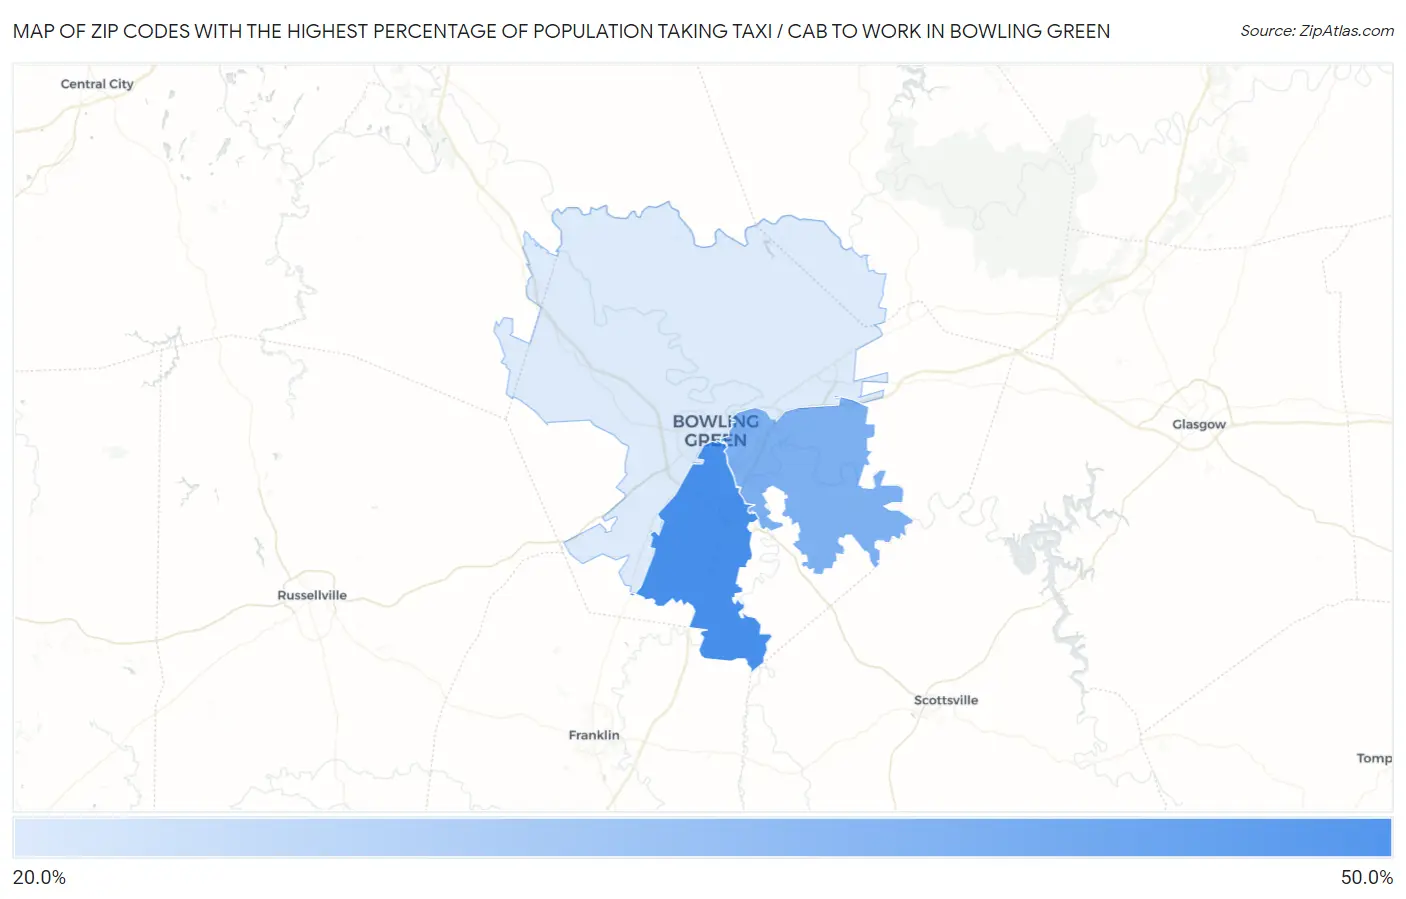
Map of Zip Codes with the Highest Percentage of Population Taking Taxi / Cab to Work in Bowling Green
0.0%
50.0%
Zip Codes with the Highest Percentage of Population Taking Taxi / Cab to Work in Bowling Green, KY
| Zip Code | % Take Taxi / Cab | vs State | vs National | |
| 1. | 42104 | 48.6% | 37.9%(+10.7)#49 | 38.2%(+10.4)#3,382 |
| 2. | 42103 | 38.9% | 37.9%(+1.00)#93 | 38.2%(+0.700)#7,106 |
| 3. | 42101 | 22.9% | 37.9%(-15.0)#152 | 38.2%(-15.3)#12,630 |
1
Common Questions
What are the Top Zip Codes with the Highest Percentage of Population Taking Taxi / Cab to Work in Bowling Green, KY?
Top Zip Codes with the Highest Percentage of Population Taking Taxi / Cab to Work in Bowling Green, KY are:
What zip code has the Highest Percentage of Population Taking Taxi / Cab to Work in Bowling Green, KY?
42104 has the Highest Percentage of Population Taking Taxi / Cab to Work in Bowling Green, KY with 48.6%.
What is the Percentage of Population Taking Taxi / Cab to Work in Bowling Green, KY?
Percentage of Population Taking Taxi / Cab to Work in Bowling Green is 22.8%.
What is the Percentage of Population Taking Taxi / Cab to Work in Kentucky?
Percentage of Population Taking Taxi / Cab to Work in Kentucky is 37.9%.
What is the Percentage of Population Taking Taxi / Cab to Work in the United States?
Percentage of Population Taking Taxi / Cab to Work in the United States is 38.2%.