Zip Codes with the Highest Percentage of Population Employed in Installation, Maintenance & Repair in Bowling Green, KY
RELATED REPORTS & OPTIONS
Installation, Maintenance & Repair
Bowling Green
Compare Zip Codes
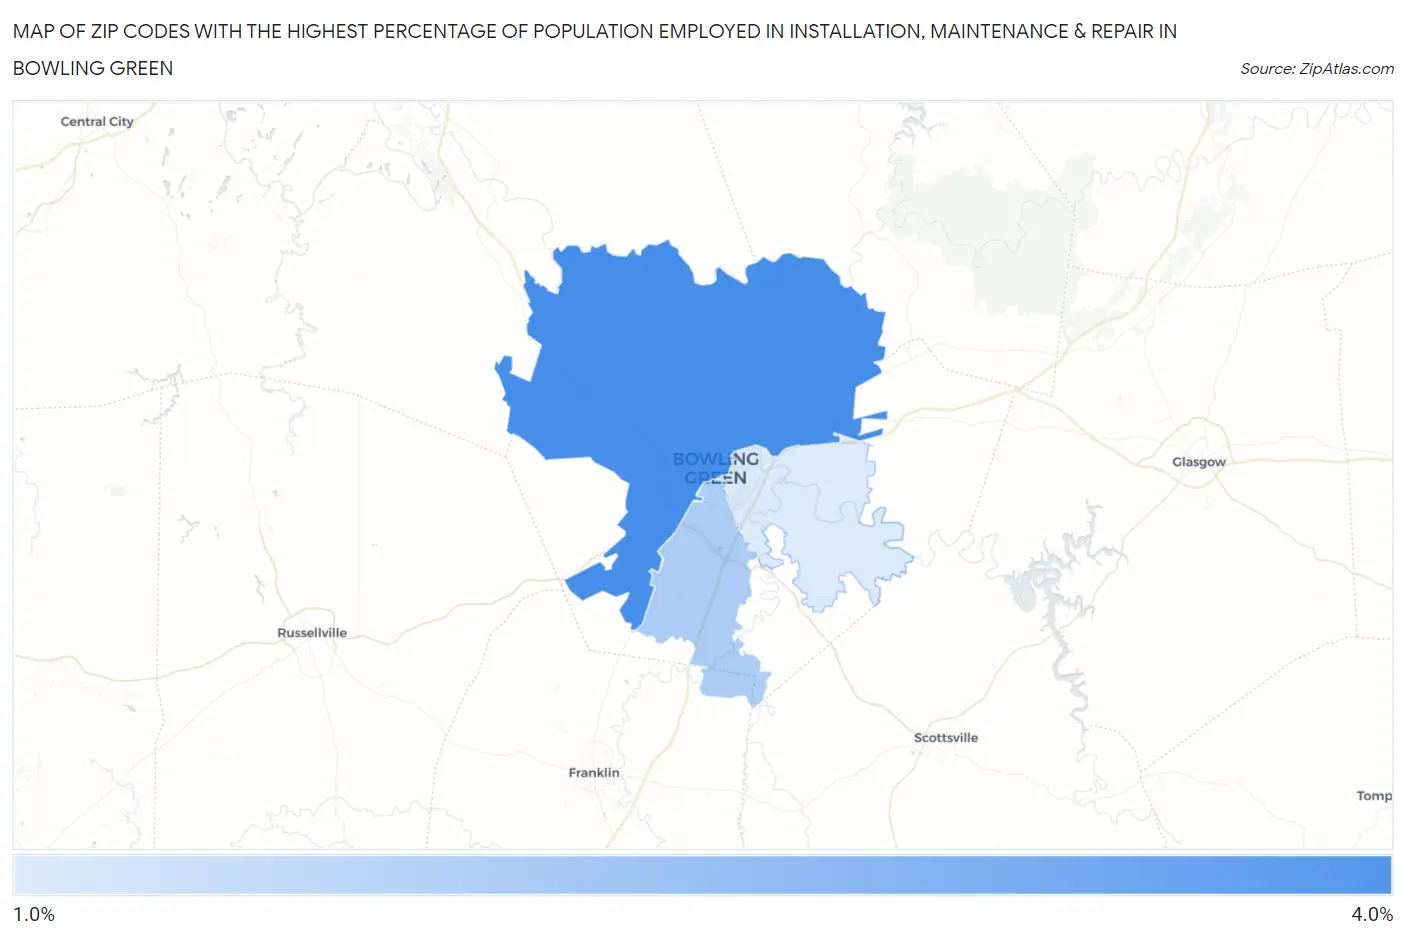
Map of Zip Codes with the Highest Percentage of Population Employed in Installation, Maintenance & Repair in Bowling Green
0.0%
4.0%
Zip Codes with the Highest Percentage of Population Employed in Installation, Maintenance & Repair in Bowling Green, KY
| Zip Code | % Employed | vs State | vs National | |
| 1. | 42101 | 3.9% | 3.5%(+0.348)#320 | 3.1%(+0.808)#12,914 |
| 2. | 42104 | 1.9% | 3.5%(-1.59)#473 | 3.1%(-1.13)#22,290 |
| 3. | 42103 | 1.1% | 3.5%(-2.47)#538 | 3.1%(-2.01)#25,742 |
1
Common Questions
What are the Top Zip Codes with the Highest Percentage of Population Employed in Installation, Maintenance & Repair in Bowling Green, KY?
Top Zip Codes with the Highest Percentage of Population Employed in Installation, Maintenance & Repair in Bowling Green, KY are:
What zip code has the Highest Percentage of Population Employed in Installation, Maintenance & Repair in Bowling Green, KY?
42101 has the Highest Percentage of Population Employed in Installation, Maintenance & Repair in Bowling Green, KY with 3.9%.
What is the Percentage of Population Employed in Installation, Maintenance & Repair in Bowling Green, KY?
Percentage of Population Employed in Installation, Maintenance & Repair in Bowling Green is 1.9%.
What is the Percentage of Population Employed in Installation, Maintenance & Repair in Kentucky?
Percentage of Population Employed in Installation, Maintenance & Repair in Kentucky is 3.5%.
What is the Percentage of Population Employed in Installation, Maintenance & Repair in the United States?
Percentage of Population Employed in Installation, Maintenance & Repair in the United States is 3.1%.