Zip Codes with the Highest Percentage of Population Employed in Administrative & Support Services in Bowling Green, KY
RELATED REPORTS & OPTIONS
Administrative & Support Services
Bowling Green
Compare Zip Codes
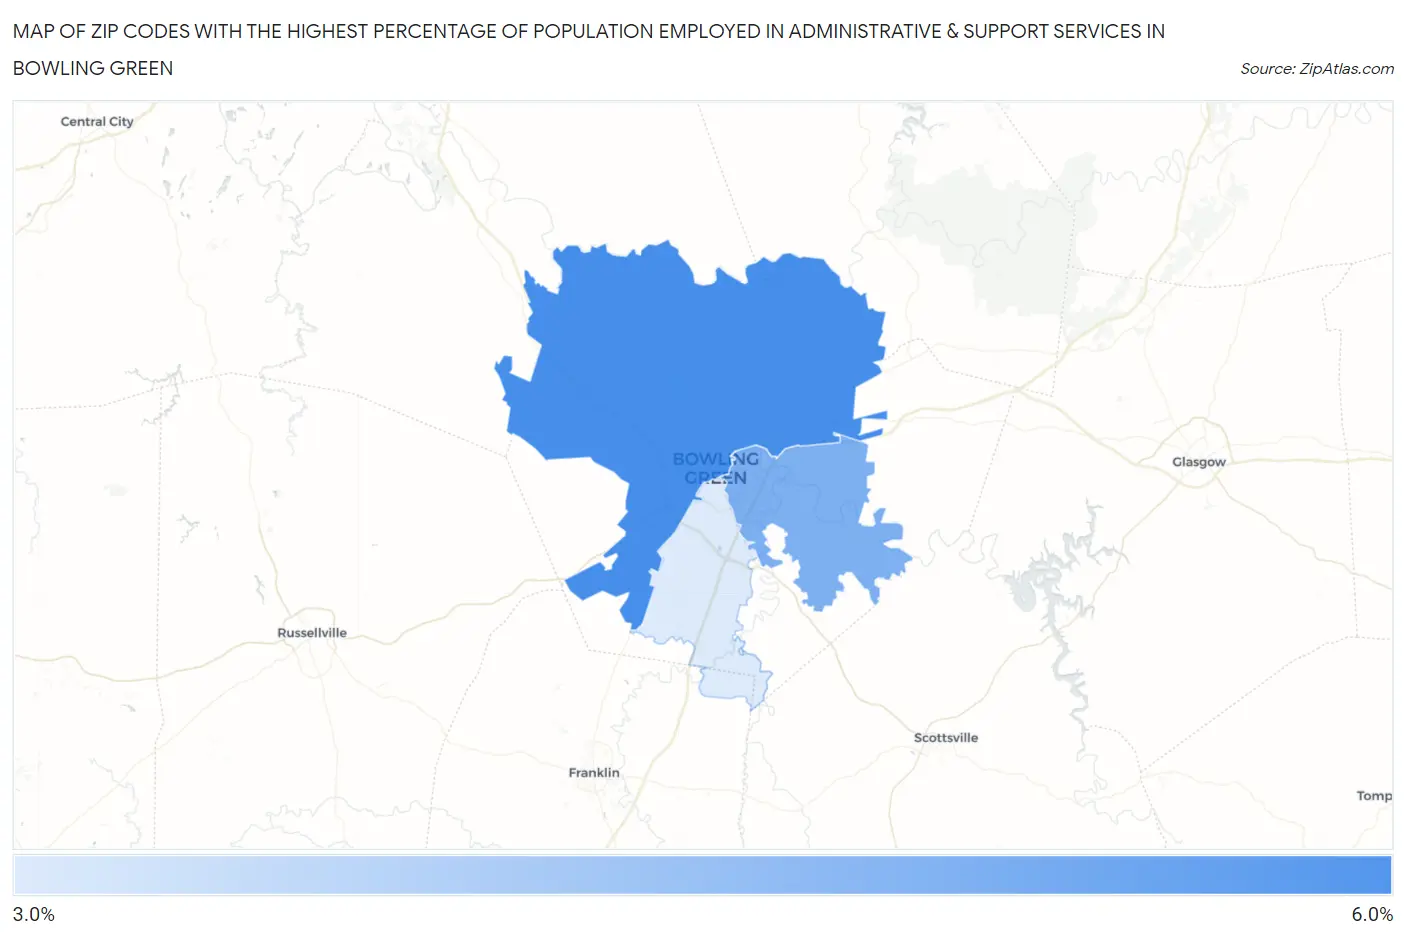
Map of Zip Codes with the Highest Percentage of Population Employed in Administrative & Support Services in Bowling Green
0.0%
6.0%
Zip Codes with the Highest Percentage of Population Employed in Administrative & Support Services in Bowling Green, KY
| Zip Code | % Employed | vs State | vs National | |
| 1. | 42101 | 5.4% | 4.0%(+1.46)#159 | 4.1%(+1.27)#6,036 |
| 2. | 42103 | 4.6% | 4.0%(+0.679)#202 | 4.1%(+0.488)#8,233 |
| 3. | 42104 | 3.3% | 4.0%(-0.687)#307 | 4.1%(-0.878)#14,100 |
1
Common Questions
What are the Top Zip Codes with the Highest Percentage of Population Employed in Administrative & Support Services in Bowling Green, KY?
Top Zip Codes with the Highest Percentage of Population Employed in Administrative & Support Services in Bowling Green, KY are:
What zip code has the Highest Percentage of Population Employed in Administrative & Support Services in Bowling Green, KY?
42101 has the Highest Percentage of Population Employed in Administrative & Support Services in Bowling Green, KY with 5.4%.
What is the Percentage of Population Employed in Administrative & Support Services in Bowling Green, KY?
Percentage of Population Employed in Administrative & Support Services in Bowling Green is 4.9%.
What is the Percentage of Population Employed in Administrative & Support Services in Kentucky?
Percentage of Population Employed in Administrative & Support Services in Kentucky is 4.0%.
What is the Percentage of Population Employed in Administrative & Support Services in the United States?
Percentage of Population Employed in Administrative & Support Services in the United States is 4.1%.