Zip Codes with the Highest Percentage of Population with a Degree in Liberal Arts and History in Bowling Green, KY
RELATED REPORTS & OPTIONS
Liberal Arts and History
Bowling Green
Compare Zip Codes
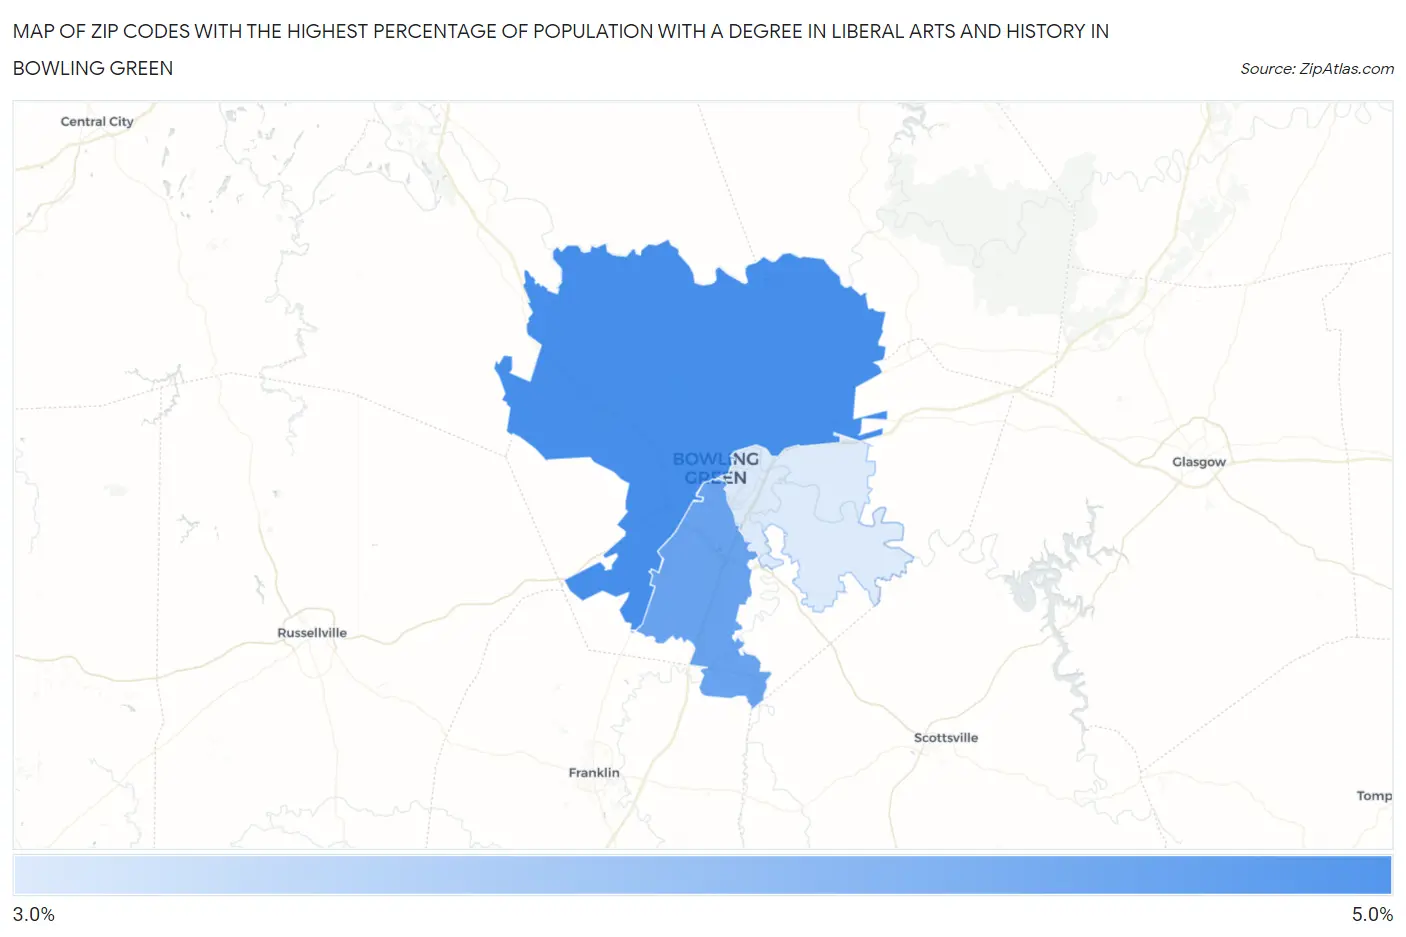
Map of Zip Codes with the Highest Percentage of Population with a Degree in Liberal Arts and History in Bowling Green
0.0%
5.0%
Zip Codes with the Highest Percentage of Population with a Degree in Liberal Arts and History in Bowling Green, KY
| Zip Code | % Graduates | vs State | vs National | |
| 1. | 42101 | 4.1% | 5.3%(-1.21)#273 | 4.9%(-0.749)#14,320 |
| 2. | 42104 | 4.1% | 5.3%(-1.27)#279 | 4.9%(-0.811)#14,539 |
| 3. | 42103 | 3.8% | 5.3%(-1.50)#294 | 4.9%(-1.04)#15,398 |
1
Common Questions
What are the Top Zip Codes with the Highest Percentage of Population with a Degree in Liberal Arts and History in Bowling Green, KY?
Top Zip Codes with the Highest Percentage of Population with a Degree in Liberal Arts and History in Bowling Green, KY are:
What zip code has the Highest Percentage of Population with a Degree in Liberal Arts and History in Bowling Green, KY?
42101 has the Highest Percentage of Population with a Degree in Liberal Arts and History in Bowling Green, KY with 4.1%.
What is the Percentage of Population with a Degree in Liberal Arts and History in Bowling Green, KY?
Percentage of Population with a Degree in Liberal Arts and History in Bowling Green is 5.0%.
What is the Percentage of Population with a Degree in Liberal Arts and History in Kentucky?
Percentage of Population with a Degree in Liberal Arts and History in Kentucky is 5.3%.
What is the Percentage of Population with a Degree in Liberal Arts and History in the United States?
Percentage of Population with a Degree in Liberal Arts and History in the United States is 4.9%.