White/Caucasian vs Ecuadorian Median Household Income
COMPARE
White/Caucasian
Ecuadorian
Median Household Income
Median Household Income Comparison
Whites/Caucasians
Ecuadorians
$82,029
MEDIAN HOUSEHOLD INCOME
12.2/ 100
METRIC RATING
218th/ 347
METRIC RANK
$82,070
MEDIAN HOUSEHOLD INCOME
12.5/ 100
METRIC RATING
217th/ 347
METRIC RANK
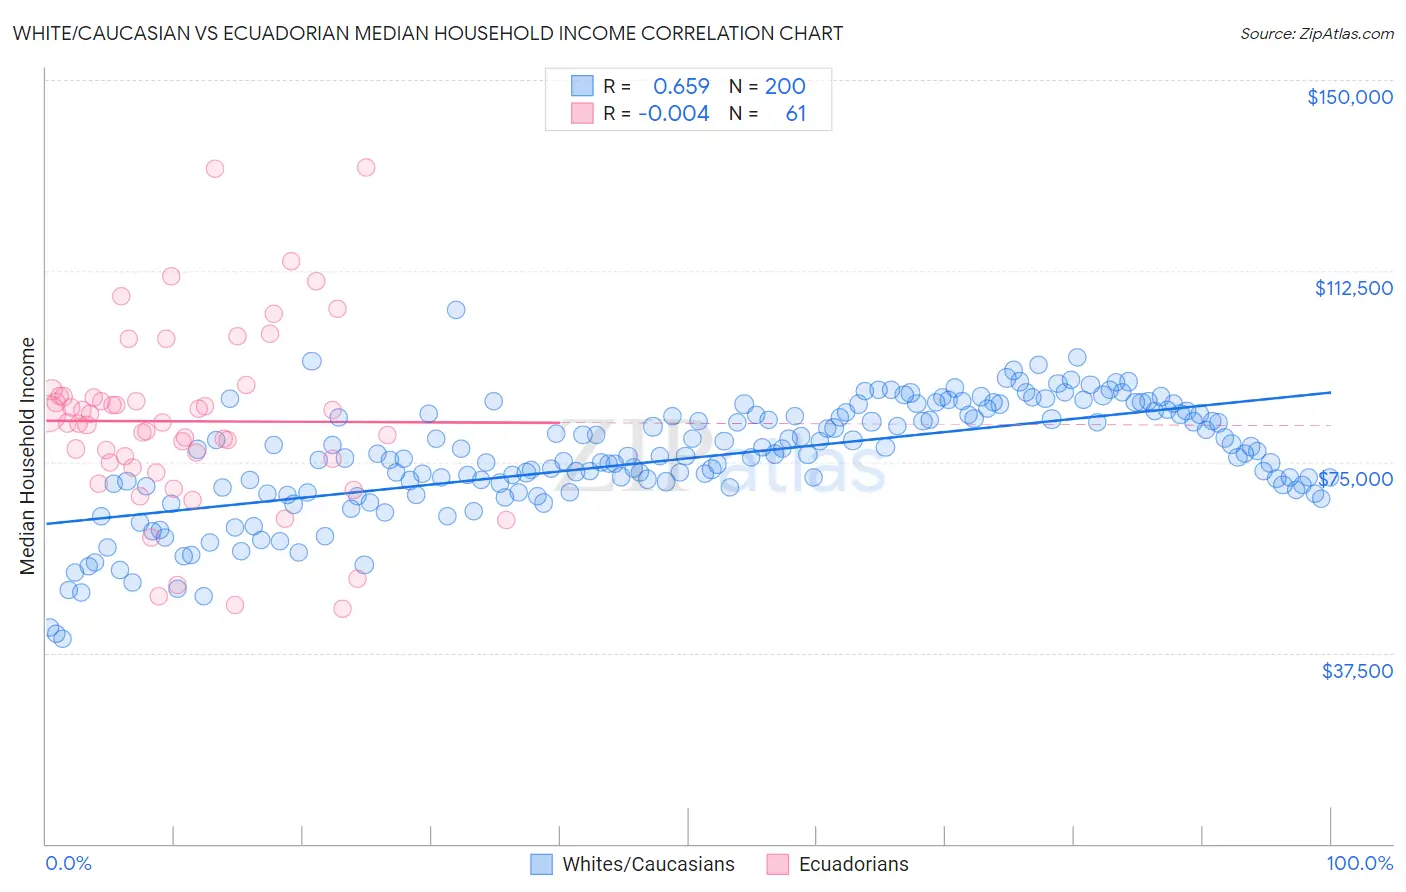
White/Caucasian vs Ecuadorian Median Household Income Correlation Chart
The statistical analysis conducted on geographies consisting of 583,274,044 people shows a significant positive correlation between the proportion of Whites/Caucasians and median household income in the United States with a correlation coefficient (R) of 0.659 and weighted average of $82,029. Similarly, the statistical analysis conducted on geographies consisting of 317,572,245 people shows no correlation between the proportion of Ecuadorians and median household income in the United States with a correlation coefficient (R) of -0.004 and weighted average of $82,070, a difference of 0.050%.
Median Household Income Correlation Summary
| Measurement | White/Caucasian | Ecuadorian |
| Minimum | $40,196 | $46,188 |
| Maximum | $104,886 | $132,837 |
| Range | $64,690 | $86,649 |
| Mean | $75,721 | $82,960 |
| Median | $76,251 | $82,671 |
| Interquartile 25% (IQ1) | $70,055 | $74,469 |
| Interquartile 75% (IQ3) | $84,369 | $87,872 |
| Interquartile Range (IQR) | $14,314 | $13,403 |
| Standard Deviation (Sample) | $11,326 | $17,786 |
| Standard Deviation (Population) | $11,297 | $17,640 |
Demographics Similar to Whites/Caucasians and Ecuadorians by Median Household Income
In terms of median household income, the demographic groups most similar to Whites/Caucasians are Yugoslavian ($82,186, a difference of 0.19%), Vietnamese ($82,248, a difference of 0.27%), Panamanian ($82,272, a difference of 0.30%), Nigerian ($81,725, a difference of 0.37%), and Nepalese ($82,410, a difference of 0.46%). Similarly, the demographic groups most similar to Ecuadorians are Yugoslavian ($82,186, a difference of 0.14%), Vietnamese ($82,248, a difference of 0.22%), Panamanian ($82,272, a difference of 0.25%), Nepalese ($82,410, a difference of 0.41%), and Nigerian ($81,725, a difference of 0.42%).
| Demographics | Rating | Rank | Median Household Income |
| Dutch | 20.3 /100 | #207 | Fair $82,971 |
| French Canadians | 18.7 /100 | #208 | Poor $82,810 |
| Immigrants | Iraq | 16.7 /100 | #209 | Poor $82,594 |
| Immigrants | Uruguay | 16.4 /100 | #210 | Poor $82,560 |
| Salvadorans | 15.4 /100 | #211 | Poor $82,449 |
| Venezuelans | 15.3 /100 | #212 | Poor $82,432 |
| Nepalese | 15.1 /100 | #213 | Poor $82,410 |
| Panamanians | 14.0 /100 | #214 | Poor $82,272 |
| Vietnamese | 13.8 /100 | #215 | Poor $82,248 |
| Yugoslavians | 13.3 /100 | #216 | Poor $82,186 |
| Ecuadorians | 12.5 /100 | #217 | Poor $82,070 |
| Whites/Caucasians | 12.2 /100 | #218 | Poor $82,029 |
| Nigerians | 10.3 /100 | #219 | Poor $81,725 |
| Immigrants | Venezuela | 9.0 /100 | #220 | Tragic $81,506 |
| Immigrants | Ghana | 9.0 /100 | #221 | Tragic $81,489 |
| Immigrants | Nigeria | 7.7 /100 | #222 | Tragic $81,236 |
| Immigrants | El Salvador | 7.6 /100 | #223 | Tragic $81,213 |
| Malaysians | 7.0 /100 | #224 | Tragic $81,064 |
| Scotch-Irish | 6.6 /100 | #225 | Tragic $80,972 |
| Immigrants | Panama | 6.2 /100 | #226 | Tragic $80,873 |
| Guyanese | 5.7 /100 | #227 | Tragic $80,734 |