Nepalese vs Nicaraguan Wage/Income Gap

COMPARE

Nepalese
Race
Ancestry
AfghanAfricanAlaska NativeAlaskan AthabascanAlbanianAleutAlsatianAmericanApacheArabArapahoArgentineanArmenianAssyrian/Chaldean/SyriacAustralianAustrianBahamianBangladeshiBarbadianBasqueBelgianBelizeanBermudanBhutaneseBlackfeetBolivianBrazilianBritishBritish West IndianBulgarianBurmeseCajunCambodianCanadianCape VerdeanCarpatho RusynCelticCentral AmericanCentral American IndianCherokeeCheyenneChickasawChileanChineseChippewaChoctawColombianColvilleComancheCosta RicanCreeCreekCroatianCrowCubanCypriotCzechCzechoslovakianDanishDelawareDominicanDutchDutch West IndianEastern EuropeanEcuadorianEgyptianEnglishEstonianEthiopianEuropeanFijianFilipinoFinnishFrenchFrench American IndianFrench CanadianGermanGerman RussianGhanaianGreekGuamanian/ChamorroGuatemalanGuyaneseHaitianHmongHonduranHopiHoumaHungarianIcelanderIndian (Asian)IndonesianInupiatIranianIraqiIrishIroquoisIsraeliItalianJamaicanJapaneseJordanianKenyanKiowaKoreanLaotianLatvianLebaneseLiberianLithuanianLumbeeLuxembourgerMacedonianMalaysianMalteseMarshalleseMenomineeMexicanMexican American IndianMongolianMoroccanNative HawaiianNavajoNepaleseNew ZealanderNigerianNorthern EuropeanNorwegianOkinawanOsageOttawaPaiutePakistaniPalestinianPanamanianParaguayanPennsylvania GermanPeruvianPimaPolishPortuguesePotawatomiPuebloPuerto RicanPuget Sound SalishRomanianRussianSalvadoranSamoanScandinavianScotch-IrishScottishSeminoleSenegaleseSerbianShoshoneSierra LeoneanSiouxSlavicSlovakSloveneSomaliSouth AfricanSouth AmericanSouth American IndianSoviet UnionSpaniardSpanishSpanish AmericanSpanish American IndianSri LankanSubsaharan AfricanSudaneseSwedishSwissSyrianTaiwaneseThaiTlingit-HaidaTohono O'OdhamTonganTrinidadian and TobagonianTsimshianTurkishU.S. Virgin IslanderUgandanUkrainianUruguayanUteVenezuelanVietnameseWelshWest IndianYakamaYaquiYugoslavianYumanYup'ikZimbabwean
Immigration
NonimmigrantsImmigrantsAfghanistanAfricaAlbaniaArgentinaArmeniaAsiaAustraliaAustriaBahamasBangladeshBarbadosBelarusBelgiumBelizeBoliviaBosnia and HerzegovinaBrazilBulgariaBurma/MyanmarCabo VerdeCambodiaCameroonCanadaCaribbeanCentral AmericaChileChinaColombiaCongoCosta RicaCroatiaCubaCzechoslovakiaDenmarkDominicaDominican RepublicEastern AfricaEastern AsiaEastern EuropeEcuadorEgyptEl SalvadorEnglandEritreaEthiopiaEuropeFijiFranceGermanyGhanaGreeceGrenadaGuatemalaGuyanaHaitiHondurasHong KongHungaryIndiaIndonesiaIranIraqIrelandIsraelItalyJamaicaJapanJordanKazakhstanKenyaKoreaKuwaitLaosLatin AmericaLatviaLebanonLiberiaLithuaniaMalaysiaMexicoMicronesiaMiddle AfricaMoldovaMoroccoNepalNetherlandsNicaraguaNigeriaNorth AmericaNorth MacedoniaNorthern AfricaNorthern EuropeNorwayOceaniaPakistanPanamaPeruPhilippinesPolandPortugalRomaniaRussiaSaudi ArabiaScotlandSenegalSerbiaSierra LeoneSingaporeSomaliaSouth AfricaSouth AmericaSouth Central AsiaSouth Eastern AsiaSouthern EuropeSpainSri LankaSt. Vincent and the GrenadinesSudanSwedenSwitzerlandSyriaTaiwanThailandTrinidad and TobagoTurkeyUgandaUkraineUruguayUzbekistanVenezuelaVietnamWest IndiesWestern AfricaWestern AsiaWestern EuropeYemenZaireZimbabweAzores
Nicaraguan
Race
Ancestry
AfghanAfricanAlaska NativeAlaskan AthabascanAlbanianAleutAlsatianAmericanApacheArabArapahoArgentineanArmenianAssyrian/Chaldean/SyriacAustralianAustrianBahamianBangladeshiBarbadianBasqueBelgianBelizeanBermudanBhutaneseBlackfeetBolivianBrazilianBritishBritish West IndianBulgarianBurmeseCajunCambodianCanadianCape VerdeanCarpatho RusynCelticCentral AmericanCentral American IndianCherokeeCheyenneChickasawChileanChineseChippewaChoctawColombianColvilleComancheCosta RicanCreeCreekCroatianCrowCubanCypriotCzechCzechoslovakianDanishDelawareDominicanDutchDutch West IndianEastern EuropeanEcuadorianEgyptianEnglishEstonianEthiopianEuropeanFijianFilipinoFinnishFrenchFrench American IndianFrench CanadianGermanGerman RussianGhanaianGreekGuamanian/ChamorroGuatemalanGuyaneseHaitianHmongHonduranHopiHoumaHungarianIcelanderIndian (Asian)IndonesianInupiatIranianIraqiIrishIroquoisIsraeliItalianJamaicanJapaneseJordanianKenyanKiowaKoreanLaotianLatvianLebaneseLiberianLithuanianLumbeeLuxembourgerMacedonianMalaysianMalteseMarshalleseMenomineeMexicanMexican American IndianMongolianMoroccanNative HawaiianNavajoNew ZealanderNicaraguanNigerianNorthern EuropeanNorwegianOkinawanOsageOttawaPaiutePakistaniPalestinianPanamanianParaguayanPennsylvania GermanPeruvianPimaPolishPortuguesePotawatomiPuebloPuerto RicanPuget Sound SalishRomanianRussianSalvadoranSamoanScandinavianScotch-IrishScottishSeminoleSenegaleseSerbianShoshoneSierra LeoneanSiouxSlavicSlovakSloveneSomaliSouth AfricanSouth AmericanSouth American IndianSoviet UnionSpaniardSpanishSpanish AmericanSpanish American IndianSri LankanSubsaharan AfricanSudaneseSwedishSwissSyrianTaiwaneseThaiTlingit-HaidaTohono O'OdhamTonganTrinidadian and TobagonianTsimshianTurkishU.S. Virgin IslanderUgandanUkrainianUruguayanUteVenezuelanVietnameseWelshWest IndianYakamaYaquiYugoslavianYumanYup'ikZimbabwean
Immigration
NonimmigrantsImmigrantsAfghanistanAfricaAlbaniaArgentinaArmeniaAsiaAustraliaAustriaBahamasBangladeshBarbadosBelarusBelgiumBelizeBoliviaBosnia and HerzegovinaBrazilBulgariaBurma/MyanmarCabo VerdeCambodiaCameroonCanadaCaribbeanCentral AmericaChileChinaColombiaCongoCosta RicaCroatiaCubaCzechoslovakiaDenmarkDominicaDominican RepublicEastern AfricaEastern AsiaEastern EuropeEcuadorEgyptEl SalvadorEnglandEritreaEthiopiaEuropeFijiFranceGermanyGhanaGreeceGrenadaGuatemalaGuyanaHaitiHondurasHong KongHungaryIndiaIndonesiaIranIraqIrelandIsraelItalyJamaicaJapanJordanKazakhstanKenyaKoreaKuwaitLaosLatin AmericaLatviaLebanonLiberiaLithuaniaMalaysiaMexicoMicronesiaMiddle AfricaMoldovaMoroccoNepalNetherlandsNicaraguaNigeriaNorth AmericaNorth MacedoniaNorthern AfricaNorthern EuropeNorwayOceaniaPakistanPanamaPeruPhilippinesPolandPortugalRomaniaRussiaSaudi ArabiaScotlandSenegalSerbiaSierra LeoneSingaporeSomaliaSouth AfricaSouth AmericaSouth Central AsiaSouth Eastern AsiaSouthern EuropeSpainSri LankaSt. Vincent and the GrenadinesSudanSwedenSwitzerlandSyriaTaiwanThailandTrinidad and TobagoTurkeyUgandaUkraineUruguayUzbekistanVenezuelaVietnamWest IndiesWestern AfricaWestern AsiaWestern EuropeYemenZaireZimbabweAzores
Wage/Income Gap
Income
Poverty
Unemployment
Labor Participation
Family Structure
Vehicle Availability
Education Level
Disability

Wage/Income Gap Comparison

Nepalese

Nicaraguans

Exceptional
Exceptional
22.2%
WAGE/INCOME GAP
100.0/ 100
METRIC RATING
54th/ 347
METRIC RANK
23.4%
WAGE/INCOME GAP
99.6/ 100
METRIC RATING
90th/ 347
METRIC RANK

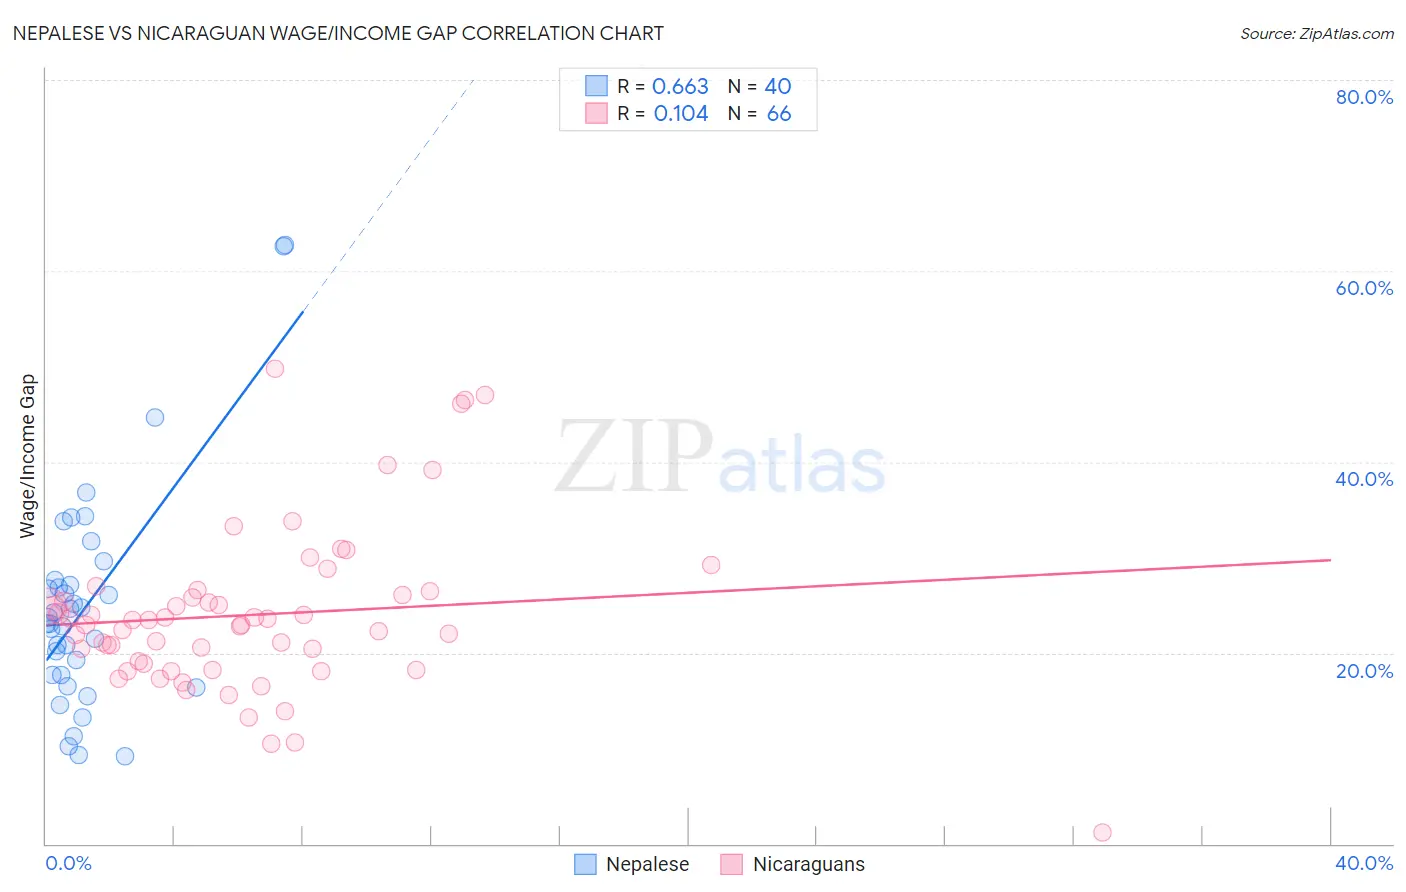
Nepalese vs Nicaraguan Wage/Income Gap Correlation Chart

The statistical analysis conducted on geographies consisting of 24,519,153 people shows a significant positive correlation between the proportion of Nepalese and wage/income gap percentage in the United States with a correlation coefficient (R) of 0.663 and weighted average of 22.2%. Similarly, the statistical analysis conducted on geographies consisting of 285,636,386 people shows a poor positive correlation between the proportion of Nicaraguans and wage/income gap percentage in the United States with a correlation coefficient (R) of 0.104 and weighted average of 23.4%, a difference of 5.5%.
Nepalese vs Nicaraguan Wage/Income Gap

Wage/Income Gap Correlation Summary

MeasurementNepaleseNicaraguan
Minimum9.1%1.2%
Maximum62.8%49.8%
Range53.7%48.6%
Mean25.0%24.0%
Median23.4%23.2%
Interquartile 25% (IQ1)17.7%18.9%
Interquartile 75% (IQ3)27.4%26.0%
Interquartile Range (IQR)9.7%7.1%
Standard Deviation (Sample)11.7%8.6%
Standard Deviation (Population)11.5%8.5%

Similar Demographics by Wage/Income Gap

Demographics Similar to Nepalese by Wage/Income Gap

In terms of wage/income gap, the demographic groups most similar to Nepalese are Bangladeshi (22.2%, a difference of 0.23%), Immigrants from Cameroon (22.2%, a difference of 0.24%), Tohono O'odham (22.1%, a difference of 0.32%), Immigrants from Zaire (22.3%, a difference of 0.40%), and Immigrants from Ghana (22.3%, a difference of 0.43%).
DemographicsRating | RankWage/Income Gap
Immigrants | Congo
100.0
/100
|
#47
Exceptional
21.7%
Blacks/African Americans
100.0
/100
|
#48
Exceptional
21.7%
Ethiopians
100.0
/100
|
#49
Exceptional
21.8%
Immigrants | Western Africa
100.0
/100
|
#50
Exceptional
22.0%
Tohono O'odham
100.0
/100
|
#51
Exceptional
22.1%
Immigrants | Cameroon
100.0
/100
|
#52
Exceptional
22.2%
Bangladeshis
100.0
/100
|
#53
Exceptional
22.2%
Nepalese
100.0
/100
|
#54
Exceptional
22.2%
Immigrants | Zaire
100.0
/100
|
#55
Exceptional
22.3%
Immigrants | Ghana
100.0
/100
|
#56
Exceptional
22.3%
Ghanaians
100.0
/100
|
#57
Exceptional
22.3%
Immigrants | Cuba
100.0
/100
|
#58
Exceptional
22.4%
Navajo
100.0
/100
|
#59
Exceptional
22.4%
Immigrants | Middle Africa
100.0
/100
|
#60
Exceptional
22.4%
Immigrants | Fiji
100.0
/100
|
#61
Exceptional
22.4%

Demographics Similar to Nicaraguans by Wage/Income Gap

In terms of wage/income gap, the demographic groups most similar to Nicaraguans are Marshallese (23.4%, a difference of 0.010%), Immigrants from Panama (23.4%, a difference of 0.10%), Arapaho (23.5%, a difference of 0.14%), Immigrants from Honduras (23.5%, a difference of 0.29%), and Yuman (23.3%, a difference of 0.42%).
DemographicsRating | RankWage/Income Gap
Immigrants | Africa
99.8
/100
|
#83
Exceptional
23.2%
Cubans
99.7
/100
|
#84
Exceptional
23.3%
Immigrants | Cambodia
99.7
/100
|
#85
Exceptional
23.3%
Cheyenne
99.7
/100
|
#86
Exceptional
23.3%
Yuman
99.7
/100
|
#87
Exceptional
23.3%
Immigrants | Panama
99.6
/100
|
#88
Exceptional
23.4%
Marshallese
99.6
/100
|
#89
Exceptional
23.4%
Nicaraguans
99.6
/100
|
#90
Exceptional
23.4%
Arapaho
99.6
/100
|
#91
Exceptional
23.5%
Immigrants | Honduras
99.5
/100
|
#92
Exceptional
23.5%
Immigrants | Cabo Verde
99.5
/100
|
#93
Exceptional
23.6%
Hondurans
99.5
/100
|
#94
Exceptional
23.6%
Cape Verdeans
99.4
/100
|
#95
Exceptional
23.6%
Kiowa
99.4
/100
|
#96
Exceptional
23.6%
Immigrants | Sudan
99.4
/100
|
#97
Exceptional
23.6%