Mongolian vs Russian Wage/Income Gap
COMPARE
Mongolian
Russian
Wage/Income Gap
Wage/Income Gap Comparison
Mongolians
Russians
26.6%
WAGE/INCOME GAP
11.4/ 100
METRIC RATING
211th/ 347
METRIC RANK
28.0%
WAGE/INCOME GAP
0.5/ 100
METRIC RATING
280th/ 347
METRIC RANK
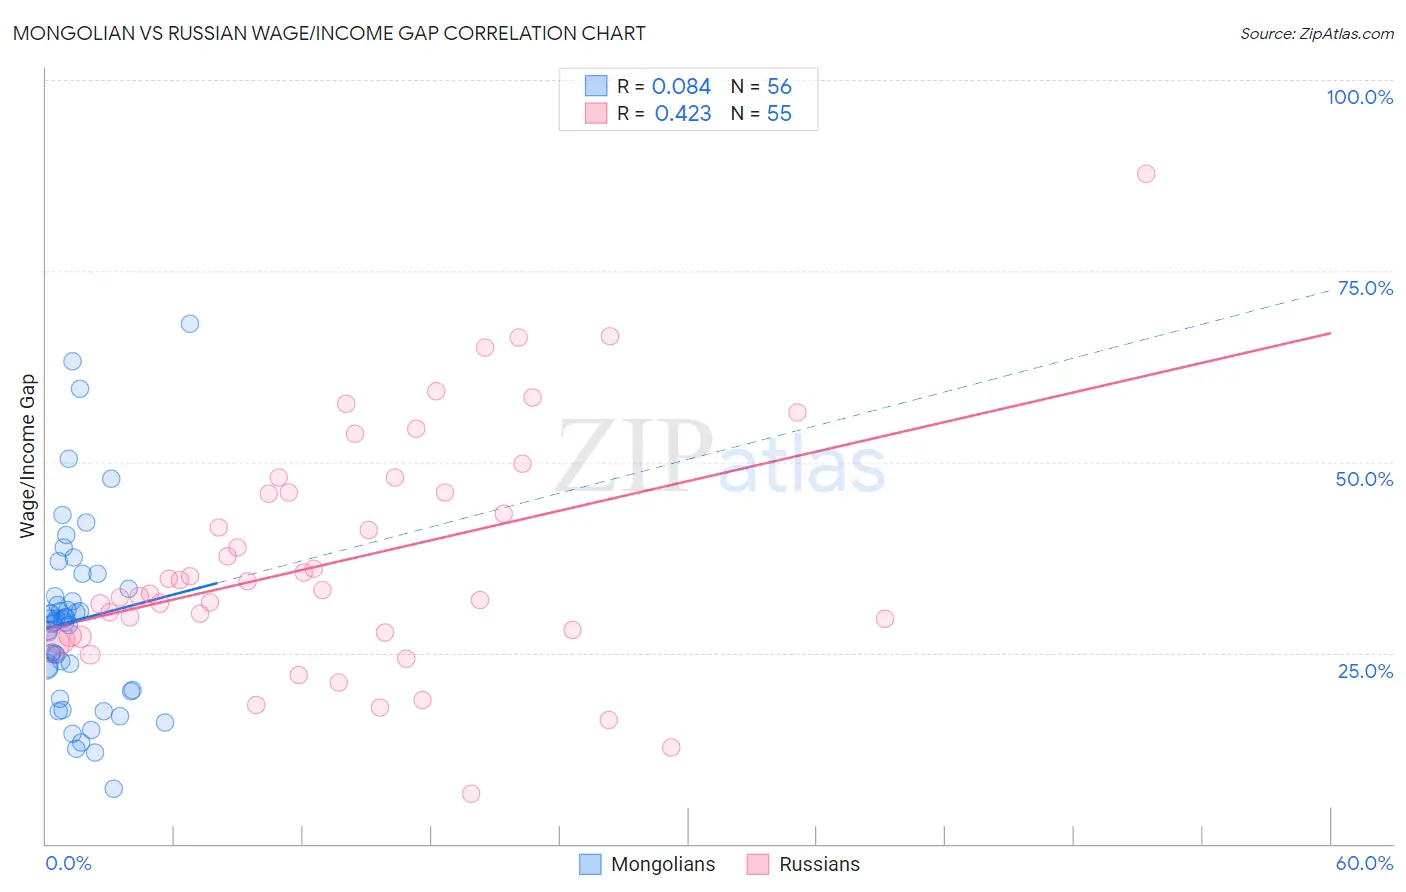
Mongolian vs Russian Wage/Income Gap Correlation Chart
The statistical analysis conducted on geographies consisting of 140,332,926 people shows a slight positive correlation between the proportion of Mongolians and wage/income gap percentage in the United States with a correlation coefficient (R) of 0.084 and weighted average of 26.6%. Similarly, the statistical analysis conducted on geographies consisting of 511,171,536 people shows a moderate positive correlation between the proportion of Russians and wage/income gap percentage in the United States with a correlation coefficient (R) of 0.423 and weighted average of 28.0%, a difference of 5.1%.
Wage/Income Gap Correlation Summary
| Measurement | Mongolian | Russian |
| Minimum | 7.3% | 6.5% |
| Maximum | 68.0% | 87.7% |
| Range | 60.8% | 81.2% |
| Mean | 29.3% | 37.1% |
| Median | 29.2% | 33.2% |
| Interquartile 25% (IQ1) | 21.7% | 27.2% |
| Interquartile 75% (IQ3) | 32.9% | 46.0% |
| Interquartile Range (IQR) | 11.2% | 18.8% |
| Standard Deviation (Sample) | 12.2% | 15.5% |
| Standard Deviation (Population) | 12.1% | 15.3% |
Similar Demographics by Wage/Income Gap
Demographics Similar to Mongolians by Wage/Income Gap
In terms of wage/income gap, the demographic groups most similar to Mongolians are Iraqi (26.6%, a difference of 0.030%), Arab (26.6%, a difference of 0.13%), Immigrants from Kuwait (26.6%, a difference of 0.17%), Immigrants from Iraq (26.7%, a difference of 0.18%), and Egyptian (26.6%, a difference of 0.19%).
| Demographics | Rating | Rank | Wage/Income Gap |
| Immigrants | Russia | 19.0 /100 | #204 | Poor 26.4% |
| Immigrants | Southern Europe | 17.3 /100 | #205 | Poor 26.4% |
| Indians (Asian) | 16.5 /100 | #206 | Poor 26.4% |
| Immigrants | Italy | 15.8 /100 | #207 | Poor 26.5% |
| Egyptians | 12.7 /100 | #208 | Poor 26.6% |
| Immigrants | Kuwait | 12.6 /100 | #209 | Poor 26.6% |
| Arabs | 12.3 /100 | #210 | Poor 26.6% |
| Mongolians | 11.4 /100 | #211 | Poor 26.6% |
| Iraqis | 11.2 /100 | #212 | Poor 26.6% |
| Immigrants | Iraq | 10.3 /100 | #213 | Poor 26.7% |
| Immigrants | China | 10.3 /100 | #214 | Poor 26.7% |
| Yugoslavians | 9.7 /100 | #215 | Tragic 26.7% |
| Immigrants | Portugal | 9.5 /100 | #216 | Tragic 26.7% |
| Brazilians | 9.2 /100 | #217 | Tragic 26.7% |
| Immigrants | Saudi Arabia | 9.1 /100 | #218 | Tragic 26.7% |
Demographics Similar to Russians by Wage/Income Gap
In terms of wage/income gap, the demographic groups most similar to Russians are Burmese (28.0%, a difference of 0.050%), South African (28.0%, a difference of 0.080%), Romanian (28.0%, a difference of 0.15%), French Canadian (28.1%, a difference of 0.26%), and Immigrants from Sweden (28.1%, a difference of 0.26%).
| Demographics | Rating | Rank | Wage/Income Gap |
| Bulgarians | 0.7 /100 | #273 | Tragic 27.8% |
| Americans | 0.7 /100 | #274 | Tragic 27.8% |
| Immigrants | Japan | 0.7 /100 | #275 | Tragic 27.9% |
| Lebanese | 0.7 /100 | #276 | Tragic 27.9% |
| Latvians | 0.7 /100 | #277 | Tragic 27.9% |
| Immigrants | England | 0.6 /100 | #278 | Tragic 27.9% |
| Romanians | 0.5 /100 | #279 | Tragic 28.0% |
| Russians | 0.5 /100 | #280 | Tragic 28.0% |
| Burmese | 0.5 /100 | #281 | Tragic 28.0% |
| South Africans | 0.5 /100 | #282 | Tragic 28.0% |
| French Canadians | 0.4 /100 | #283 | Tragic 28.1% |
| Immigrants | Sweden | 0.4 /100 | #284 | Tragic 28.1% |
| Italians | 0.4 /100 | #285 | Tragic 28.1% |
| Immigrants | Austria | 0.4 /100 | #286 | Tragic 28.1% |
| Okinawans | 0.4 /100 | #287 | Tragic 28.1% |