Immigrants from Peru vs British Wage/Income Gap

COMPARE

Immigrants from Peru
Race
Ancestry
AfghanAfricanAlaska NativeAlaskan AthabascanAlbanianAleutAlsatianAmericanApacheArabArapahoArgentineanArmenianAssyrian/Chaldean/SyriacAustralianAustrianBahamianBangladeshiBarbadianBasqueBelgianBelizeanBermudanBhutaneseBlackfeetBolivianBrazilianBritish West IndianBulgarianBurmeseCajunCambodianCanadianCape VerdeanCarpatho RusynCelticCentral AmericanCentral American IndianCherokeeCheyenneChickasawChileanChineseChippewaChoctawColombianColvilleComancheCosta RicanCreeCreekCroatianCrowCubanCypriotCzechCzechoslovakianDanishDelawareDominicanDutchDutch West IndianEastern EuropeanEcuadorianEgyptianEnglishEstonianEthiopianEuropeanFijianFilipinoFinnishFrenchFrench American IndianFrench CanadianGermanGerman RussianGhanaianGreekGuamanian/ChamorroGuatemalanGuyaneseHaitianHmongHonduranHopiHoumaHungarianIcelanderIndian (Asian)IndonesianInupiatIranianIraqiIrishIroquoisIsraeliItalianJamaicanJapaneseJordanianKenyanKiowaKoreanLaotianLatvianLebaneseLiberianLithuanianLumbeeLuxembourgerMacedonianMalaysianMalteseMarshalleseMenomineeMexicanMexican American IndianMongolianMoroccanNative HawaiianNavajoNepaleseNew ZealanderNicaraguanNigerianNorthern EuropeanNorwegianOkinawanOsageOttawaPaiutePakistaniPalestinianPanamanianParaguayanPennsylvania GermanPeruvianPimaPolishPortuguesePotawatomiPuebloPuerto RicanPuget Sound SalishRomanianRussianSalvadoranSamoanScandinavianScotch-IrishScottishSeminoleSenegaleseSerbianShoshoneSierra LeoneanSiouxSlavicSlovakSloveneSomaliSouth AfricanSouth AmericanSouth American IndianSoviet UnionSpaniardSpanishSpanish AmericanSpanish American IndianSri LankanSubsaharan AfricanSudaneseSwedishSwissSyrianTaiwaneseThaiTlingit-HaidaTohono O'OdhamTonganTrinidadian and TobagonianTsimshianTurkishU.S. Virgin IslanderUgandanUkrainianUruguayanUteVenezuelanVietnameseWelshWest IndianYakamaYaquiYugoslavianYumanYup'ikZimbabwean
Immigration
NonimmigrantsImmigrantsAfghanistanAfricaAlbaniaArgentinaArmeniaAsiaAustraliaAustriaBahamasBangladeshBarbadosBelarusBelgiumBelizeBoliviaBosnia and HerzegovinaBrazilBulgariaBurma/MyanmarCabo VerdeCambodiaCameroonCanadaCaribbeanCentral AmericaChileChinaColombiaCongoCosta RicaCroatiaCubaCzechoslovakiaDenmarkDominicaDominican RepublicEastern AfricaEastern AsiaEastern EuropeEcuadorEgyptEl SalvadorEnglandEritreaEthiopiaEuropeFijiFranceGermanyGhanaGreeceGrenadaGuatemalaGuyanaHaitiHondurasHong KongHungaryIndiaIndonesiaIranIraqIrelandIsraelItalyJamaicaJapanJordanKazakhstanKenyaKoreaKuwaitLaosLatin AmericaLatviaLebanonLiberiaLithuaniaMalaysiaMexicoMicronesiaMiddle AfricaMoldovaMoroccoNepalNetherlandsNicaraguaNigeriaNorth AmericaNorth MacedoniaNorthern AfricaNorthern EuropeNorwayOceaniaPakistanPanamaPeruPhilippinesPolandPortugalRomaniaRussiaSaudi ArabiaScotlandSenegalSerbiaSierra LeoneSingaporeSomaliaSouth AfricaSouth AmericaSouth Central AsiaSouth Eastern AsiaSouthern EuropeSpainSri LankaSt. Vincent and the GrenadinesSudanSwedenSwitzerlandSyriaTaiwanThailandTrinidad and TobagoTurkeyUgandaUkraineUruguayUzbekistanVenezuelaVietnamWest IndiesWestern AfricaWestern AsiaWestern EuropeYemenZaireZimbabweAzores
British
Race
Ancestry
AfghanAfricanAlaska NativeAlaskan AthabascanAlbanianAleutAlsatianAmericanApacheArabArapahoArgentineanArmenianAssyrian/Chaldean/SyriacAustralianAustrianBahamianBangladeshiBarbadianBasqueBelgianBelizeanBermudanBhutaneseBlackfeetBolivianBrazilianBritishBritish West IndianBulgarianBurmeseCajunCambodianCanadianCape VerdeanCarpatho RusynCelticCentral AmericanCentral American IndianCherokeeCheyenneChickasawChileanChineseChippewaChoctawColombianColvilleComancheCosta RicanCreeCreekCroatianCrowCubanCypriotCzechCzechoslovakianDanishDelawareDominicanDutchDutch West IndianEastern EuropeanEcuadorianEgyptianEnglishEstonianEthiopianEuropeanFijianFilipinoFinnishFrenchFrench American IndianFrench CanadianGermanGerman RussianGhanaianGreekGuamanian/ChamorroGuatemalanGuyaneseHaitianHmongHonduranHopiHoumaHungarianIcelanderIndian (Asian)IndonesianInupiatIranianIraqiIrishIroquoisIsraeliItalianJamaicanJapaneseJordanianKenyanKiowaKoreanLaotianLatvianLebaneseLiberianLithuanianLumbeeLuxembourgerMacedonianMalaysianMalteseMarshalleseMenomineeMexicanMexican American IndianMongolianMoroccanNative HawaiianNavajoNepaleseNew ZealanderNicaraguanNigerianNorthern EuropeanNorwegianOkinawanOsageOttawaPaiutePakistaniPalestinianPanamanianParaguayanPennsylvania GermanPeruvianPimaPolishPortuguesePotawatomiPuebloPuerto RicanPuget Sound SalishRomanianRussianSalvadoranSamoanScandinavianScotch-IrishScottishSeminoleSenegaleseSerbianShoshoneSierra LeoneanSiouxSlavicSlovakSloveneSomaliSouth AfricanSouth AmericanSouth American IndianSoviet UnionSpaniardSpanishSpanish AmericanSpanish American IndianSri LankanSubsaharan AfricanSudaneseSwedishSwissSyrianTaiwaneseThaiTlingit-HaidaTohono O'OdhamTonganTrinidadian and TobagonianTsimshianTurkishU.S. Virgin IslanderUgandanUkrainianUruguayanUteVenezuelanVietnameseWelshWest IndianYakamaYaquiYugoslavianYumanYup'ikZimbabwean
Immigration
NonimmigrantsImmigrantsAfghanistanAfricaAlbaniaArgentinaArmeniaAsiaAustraliaAustriaBahamasBangladeshBarbadosBelarusBelgiumBelizeBoliviaBosnia and HerzegovinaBrazilBulgariaBurma/MyanmarCabo VerdeCambodiaCameroonCanadaCaribbeanCentral AmericaChileChinaColombiaCongoCosta RicaCroatiaCubaCzechoslovakiaDenmarkDominicaDominican RepublicEastern AfricaEastern AsiaEastern EuropeEcuadorEgyptEl SalvadorEnglandEritreaEthiopiaEuropeFijiFranceGermanyGhanaGreeceGrenadaGuatemalaGuyanaHaitiHondurasHong KongHungaryIndiaIndonesiaIranIraqIrelandIsraelItalyJamaicaJapanJordanKazakhstanKenyaKoreaKuwaitLaosLatin AmericaLatviaLebanonLiberiaLithuaniaMalaysiaMexicoMicronesiaMiddle AfricaMoldovaMoroccoNepalNetherlandsNicaraguaNigeriaNorth AmericaNorth MacedoniaNorthern AfricaNorthern EuropeNorwayOceaniaPakistanPanamaPhilippinesPolandPortugalRomaniaRussiaSaudi ArabiaScotlandSenegalSerbiaSierra LeoneSingaporeSomaliaSouth AfricaSouth AmericaSouth Central AsiaSouth Eastern AsiaSouthern EuropeSpainSri LankaSt. Vincent and the GrenadinesSudanSwedenSwitzerlandSyriaTaiwanThailandTrinidad and TobagoTurkeyUgandaUkraineUruguayUzbekistanVenezuelaVietnamWest IndiesWestern AfricaWestern AsiaWestern EuropeYemenZaireZimbabweAzores
Wage/Income Gap
Income
Poverty
Unemployment
Labor Participation
Family Structure
Vehicle Availability
Education Level
Disability

Wage/Income Gap Comparison

Immigrants from Peru

British

Excellent
Tragic
25.1%
WAGE/INCOME GAP
82.6/ 100
METRIC RATING
149th/ 347
METRIC RANK
28.9%
WAGE/INCOME GAP
0.1/ 100
METRIC RATING
320th/ 347
METRIC RANK

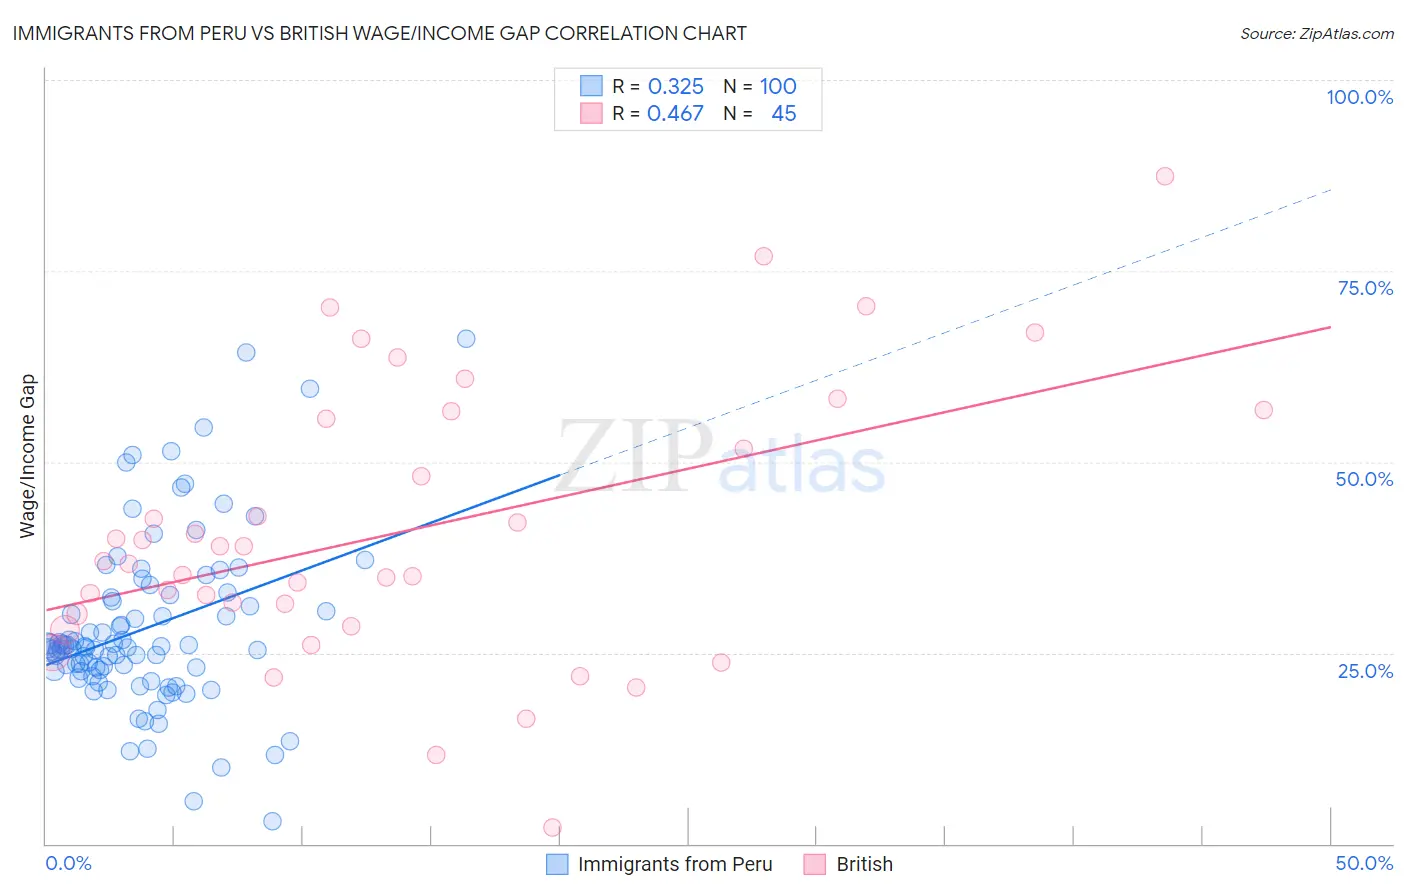
Immigrants from Peru vs British Wage/Income Gap Correlation Chart

The statistical analysis conducted on geographies consisting of 328,741,739 people shows a mild positive correlation between the proportion of Immigrants from Peru and wage/income gap percentage in the United States with a correlation coefficient (R) of 0.325 and weighted average of 25.1%. Similarly, the statistical analysis conducted on geographies consisting of 530,131,618 people shows a moderate positive correlation between the proportion of British and wage/income gap percentage in the United States with a correlation coefficient (R) of 0.467 and weighted average of 28.9%, a difference of 15.1%.
Immigrants from Peru vs British Wage/Income Gap

Wage/Income Gap Correlation Summary

MeasurementImmigrants from PeruBritish
Minimum2.9%2.2%
Maximum66.2%87.4%
Range63.3%85.2%
Mean28.2%41.0%
Median25.8%37.0%
Interquartile 25% (IQ1)22.6%29.3%
Interquartile 75% (IQ3)32.4%56.1%
Interquartile Range (IQR)9.8%26.8%
Standard Deviation (Sample)11.3%18.1%
Standard Deviation (Population)11.2%17.9%

Similar Demographics by Wage/Income Gap

Demographics Similar to Immigrants from Peru by Wage/Income Gap

In terms of wage/income gap, the demographic groups most similar to Immigrants from Peru are Immigrants (25.1%, a difference of 0.040%), Taiwanese (25.1%, a difference of 0.12%), Iroquois (25.1%, a difference of 0.15%), Uruguayan (25.2%, a difference of 0.16%), and Malaysian (25.0%, a difference of 0.28%).
DemographicsRating | RankWage/Income Gap
Afghans
88.1
/100
|
#142
Excellent
24.9%
Immigrants | Uganda
88.0
/100
|
#143
Excellent
24.9%
Chippewa
86.9
/100
|
#144
Excellent
25.0%
Comanche
85.2
/100
|
#145
Excellent
25.0%
South Americans
85.2
/100
|
#146
Excellent
25.0%
Malaysians
84.9
/100
|
#147
Excellent
25.0%
Iroquois
83.9
/100
|
#148
Excellent
25.1%
Immigrants | Peru
82.6
/100
|
#149
Excellent
25.1%
Immigrants | Immigrants
82.3
/100
|
#150
Excellent
25.1%
Taiwanese
81.6
/100
|
#151
Excellent
25.1%
Uruguayans
81.3
/100
|
#152
Excellent
25.2%
Blackfeet
78.1
/100
|
#153
Good
25.2%
Immigrants | Northern Africa
78.1
/100
|
#154
Good
25.2%
Immigrants | Vietnam
77.7
/100
|
#155
Good
25.2%
Immigrants | Mexico
76.4
/100
|
#156
Good
25.3%

Demographics Similar to British by Wage/Income Gap

In terms of wage/income gap, the demographic groups most similar to British are Slovak (28.9%, a difference of 0.060%), Welsh (28.9%, a difference of 0.070%), Immigrants from Singapore (28.9%, a difference of 0.080%), Norwegian (29.0%, a difference of 0.19%), and Croatian (29.0%, a difference of 0.31%).
DemographicsRating | RankWage/Income Gap
French
0.1
/100
|
#313
Tragic
28.7%
Immigrants | Scotland
0.1
/100
|
#314
Tragic
28.7%
Maltese
0.1
/100
|
#315
Tragic
28.7%
Lithuanians
0.1
/100
|
#316
Tragic
28.7%
Belgians
0.1
/100
|
#317
Tragic
28.8%
Basques
0.1
/100
|
#318
Tragic
28.8%
Slovaks
0.1
/100
|
#319
Tragic
28.9%
British
0.1
/100
|
#320
Tragic
28.9%
Welsh
0.1
/100
|
#321
Tragic
28.9%
Immigrants | Singapore
0.1
/100
|
#322
Tragic
28.9%
Norwegians
0.1
/100
|
#323
Tragic
29.0%
Croatians
0.0
/100
|
#324
Tragic
29.0%
Hungarians
0.0
/100
|
#325
Tragic
29.0%
Immigrants | Belgium
0.0
/100
|
#326
Tragic
29.0%
Immigrants | Iran
0.0
/100
|
#327
Tragic
29.1%