Bolivian vs Immigrants from Costa Rica Wage/Income Gap
COMPARE
Bolivian
Immigrants from Costa Rica
Wage/Income Gap
Wage/Income Gap Comparison
Bolivians
Immigrants from Costa Rica
26.8%
WAGE/INCOME GAP
8.3/ 100
METRIC RATING
222nd/ 347
METRIC RANK
24.7%
WAGE/INCOME GAP
92.4/ 100
METRIC RATING
132nd/ 347
METRIC RANK
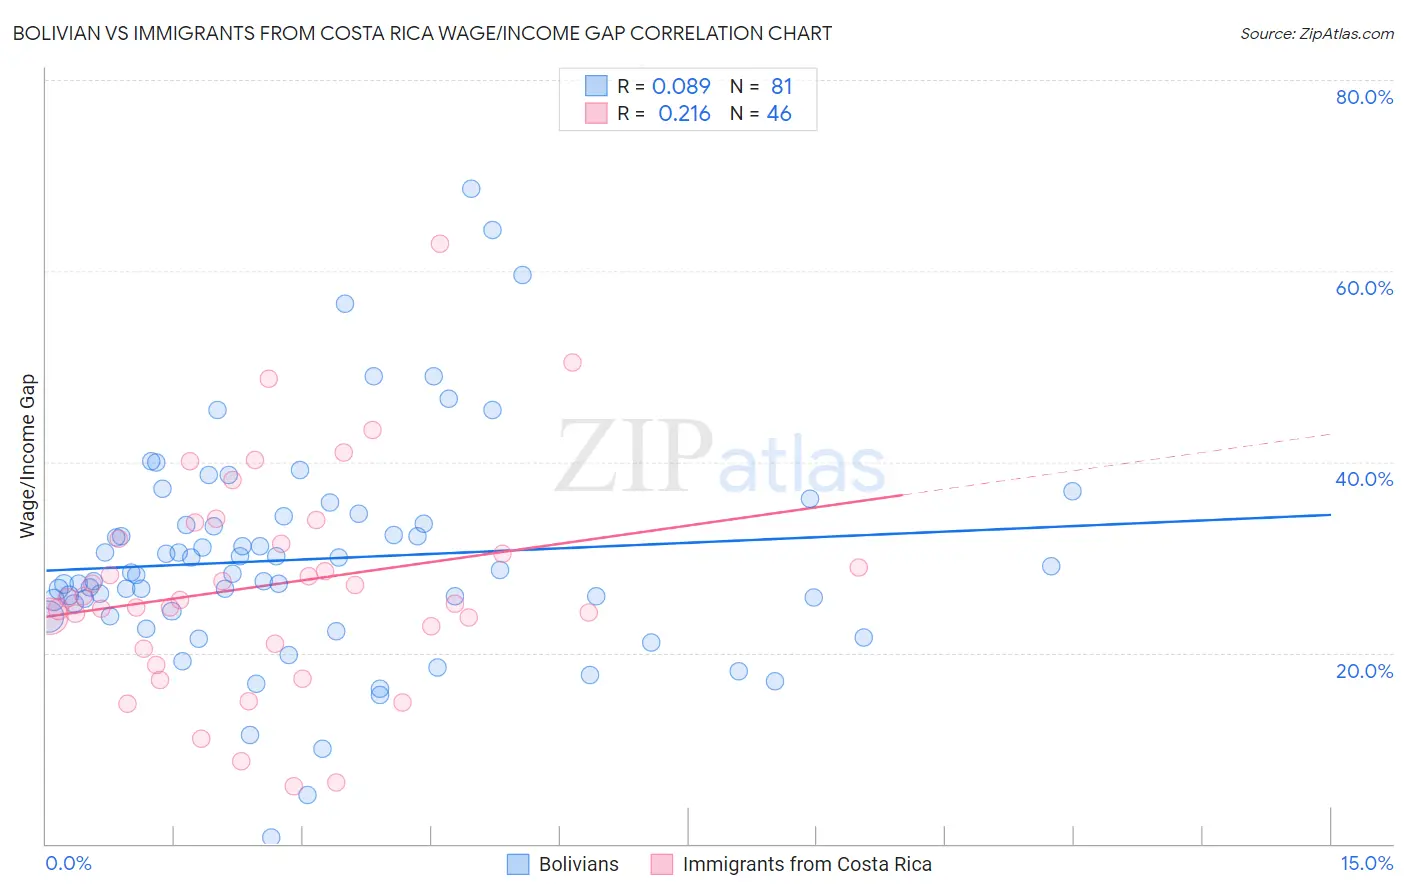
Bolivian vs Immigrants from Costa Rica Wage/Income Gap Correlation Chart
The statistical analysis conducted on geographies consisting of 184,654,988 people shows a slight positive correlation between the proportion of Bolivians and wage/income gap percentage in the United States with a correlation coefficient (R) of 0.089 and weighted average of 26.8%. Similarly, the statistical analysis conducted on geographies consisting of 204,249,017 people shows a weak positive correlation between the proportion of Immigrants from Costa Rica and wage/income gap percentage in the United States with a correlation coefficient (R) of 0.216 and weighted average of 24.7%, a difference of 8.3%.
Wage/Income Gap Correlation Summary
| Measurement | Bolivian | Immigrants from Costa Rica |
| Minimum | 0.64% | 6.0% |
| Maximum | 68.5% | 62.8% |
| Range | 67.9% | 56.8% |
| Mean | 29.8% | 27.1% |
| Median | 28.3% | 25.7% |
| Interquartile 25% (IQ1) | 24.1% | 20.9% |
| Interquartile 75% (IQ3) | 33.9% | 31.9% |
| Interquartile Range (IQR) | 9.8% | 11.0% |
| Standard Deviation (Sample) | 11.6% | 11.3% |
| Standard Deviation (Population) | 11.5% | 11.2% |
Similar Demographics by Wage/Income Gap
Demographics Similar to Bolivians by Wage/Income Gap
In terms of wage/income gap, the demographic groups most similar to Bolivians are Immigrants from Spain (26.8%, a difference of 0.040%), Jordanian (26.8%, a difference of 0.070%), Immigrants from Latvia (26.7%, a difference of 0.11%), Immigrants from Poland (26.7%, a difference of 0.12%), and Immigrants from Saudi Arabia (26.7%, a difference of 0.15%).
| Demographics | Rating | Rank | Wage/Income Gap |
| Yugoslavians | 9.7 /100 | #215 | Tragic 26.7% |
| Immigrants | Portugal | 9.5 /100 | #216 | Tragic 26.7% |
| Brazilians | 9.2 /100 | #217 | Tragic 26.7% |
| Immigrants | Saudi Arabia | 9.1 /100 | #218 | Tragic 26.7% |
| Immigrants | Poland | 8.9 /100 | #219 | Tragic 26.7% |
| Immigrants | Latvia | 8.9 /100 | #220 | Tragic 26.7% |
| Immigrants | Spain | 8.5 /100 | #221 | Tragic 26.8% |
| Bolivians | 8.3 /100 | #222 | Tragic 26.8% |
| Jordanians | 8.0 /100 | #223 | Tragic 26.8% |
| Immigrants | Argentina | 7.2 /100 | #224 | Tragic 26.8% |
| Immigrants | Ireland | 6.5 /100 | #225 | Tragic 26.9% |
| Asians | 5.9 /100 | #226 | Tragic 26.9% |
| Spaniards | 5.6 /100 | #227 | Tragic 27.0% |
| Immigrants | Turkey | 5.6 /100 | #228 | Tragic 27.0% |
| Immigrants | Asia | 5.5 /100 | #229 | Tragic 27.0% |
Demographics Similar to Immigrants from Costa Rica by Wage/Income Gap
In terms of wage/income gap, the demographic groups most similar to Immigrants from Costa Rica are Colombian (24.7%, a difference of 0.0%), Mexican American Indian (24.7%, a difference of 0.040%), South American Indian (24.7%, a difference of 0.10%), Immigrants from Philippines (24.7%, a difference of 0.15%), and Alsatian (24.7%, a difference of 0.22%).
| Demographics | Rating | Rank | Wage/Income Gap |
| Spanish Americans | 93.8 /100 | #125 | Exceptional 24.6% |
| Immigrants | Uruguay | 93.8 /100 | #126 | Exceptional 24.6% |
| German Russians | 93.7 /100 | #127 | Exceptional 24.6% |
| Immigrants | Central America | 93.5 /100 | #128 | Exceptional 24.6% |
| Yup'ik | 93.3 /100 | #129 | Exceptional 24.7% |
| Alsatians | 93.2 /100 | #130 | Exceptional 24.7% |
| Immigrants | Philippines | 93.0 /100 | #131 | Exceptional 24.7% |
| Immigrants | Costa Rica | 92.4 /100 | #132 | Exceptional 24.7% |
| Colombians | 92.4 /100 | #133 | Exceptional 24.7% |
| Mexican American Indians | 92.2 /100 | #134 | Exceptional 24.7% |
| South American Indians | 92.0 /100 | #135 | Exceptional 24.7% |
| Armenians | 91.3 /100 | #136 | Exceptional 24.8% |
| Immigrants | South Eastern Asia | 90.9 /100 | #137 | Exceptional 24.8% |
| Immigrants | Bosnia and Herzegovina | 90.1 /100 | #138 | Exceptional 24.8% |
| Hispanics or Latinos | 89.5 /100 | #139 | Excellent 24.9% |