Zip Codes with the Highest Percentage of Population Employed in Arts, Media & Entertainment in Greenwood, IN
RELATED REPORTS & OPTIONS
Arts, Media & Entertainment
Greenwood
Compare Zip Codes
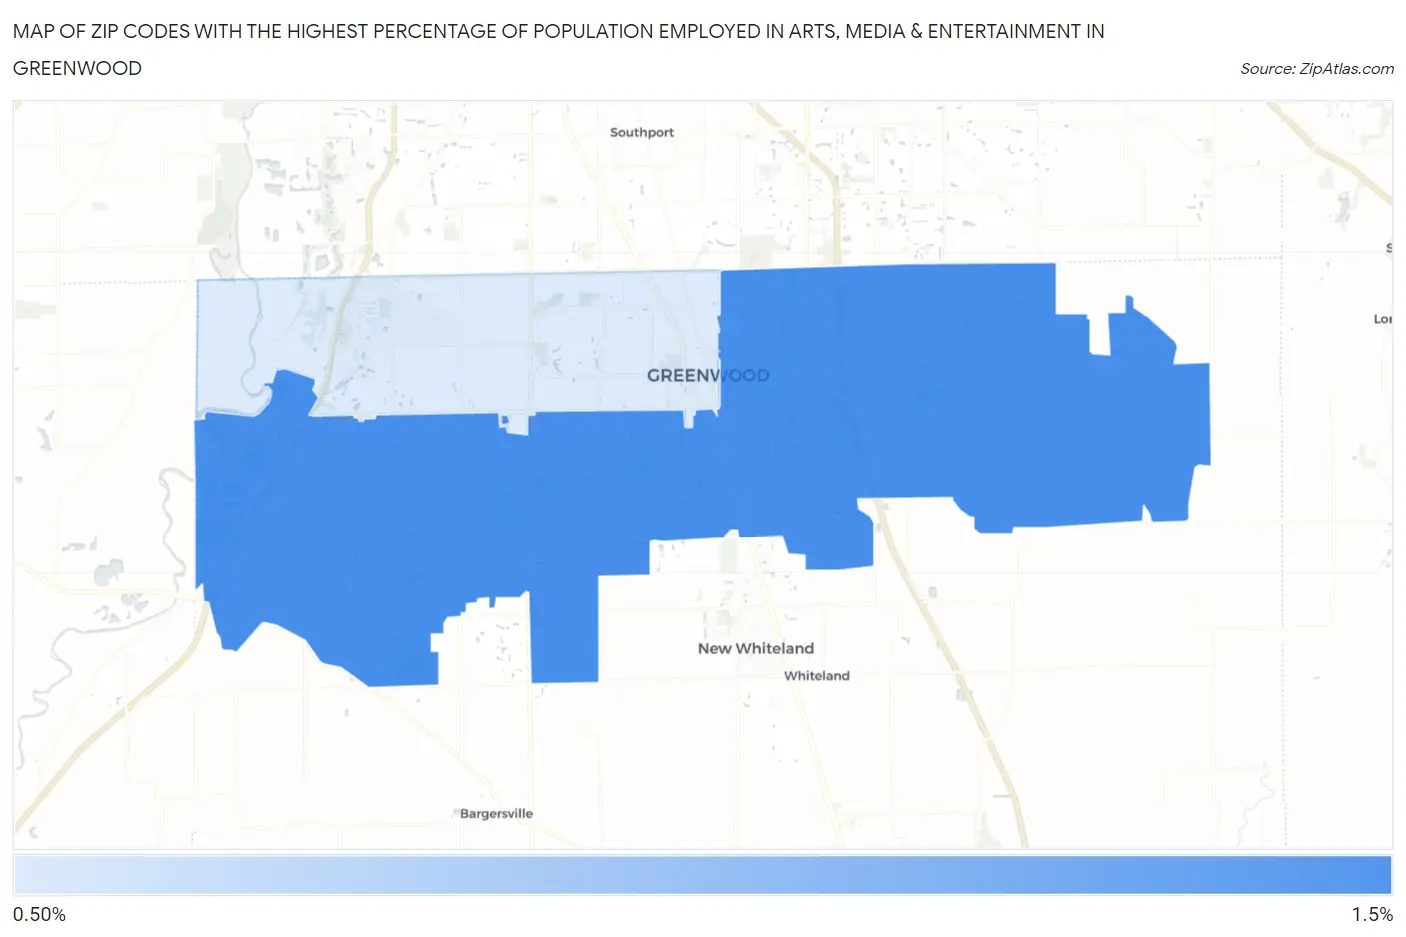
Map of Zip Codes with the Highest Percentage of Population Employed in Arts, Media & Entertainment in Greenwood
0.0%
1.5%
Zip Codes with the Highest Percentage of Population Employed in Arts, Media & Entertainment in Greenwood, IN
| Zip Code | % Employed | vs State | vs National | |
| 1. | 46143 | 1.1% | 1.4%(-0.327)#259 | 2.1%(-0.976)#14,125 |
| 2. | 46142 | 0.92% | 1.4%(-0.491)#303 | 2.1%(-1.14)#15,461 |
1
Common Questions
What are the Top Zip Codes with the Highest Percentage of Population Employed in Arts, Media & Entertainment in Greenwood, IN?
Top Zip Codes with the Highest Percentage of Population Employed in Arts, Media & Entertainment in Greenwood, IN are:
What zip code has the Highest Percentage of Population Employed in Arts, Media & Entertainment in Greenwood, IN?
46143 has the Highest Percentage of Population Employed in Arts, Media & Entertainment in Greenwood, IN with 1.1%.
What is the Percentage of Population Employed in Arts, Media & Entertainment in Greenwood, IN?
Percentage of Population Employed in Arts, Media & Entertainment in Greenwood is 0.88%.
What is the Percentage of Population Employed in Arts, Media & Entertainment in Indiana?
Percentage of Population Employed in Arts, Media & Entertainment in Indiana is 1.4%.
What is the Percentage of Population Employed in Arts, Media & Entertainment in the United States?
Percentage of Population Employed in Arts, Media & Entertainment in the United States is 2.1%.