Zip Codes with the Highest Percentage of Population Employed in Arts, Media & Entertainment in Columbus, IN
RELATED REPORTS & OPTIONS
Arts, Media & Entertainment
Columbus
Compare Zip Codes
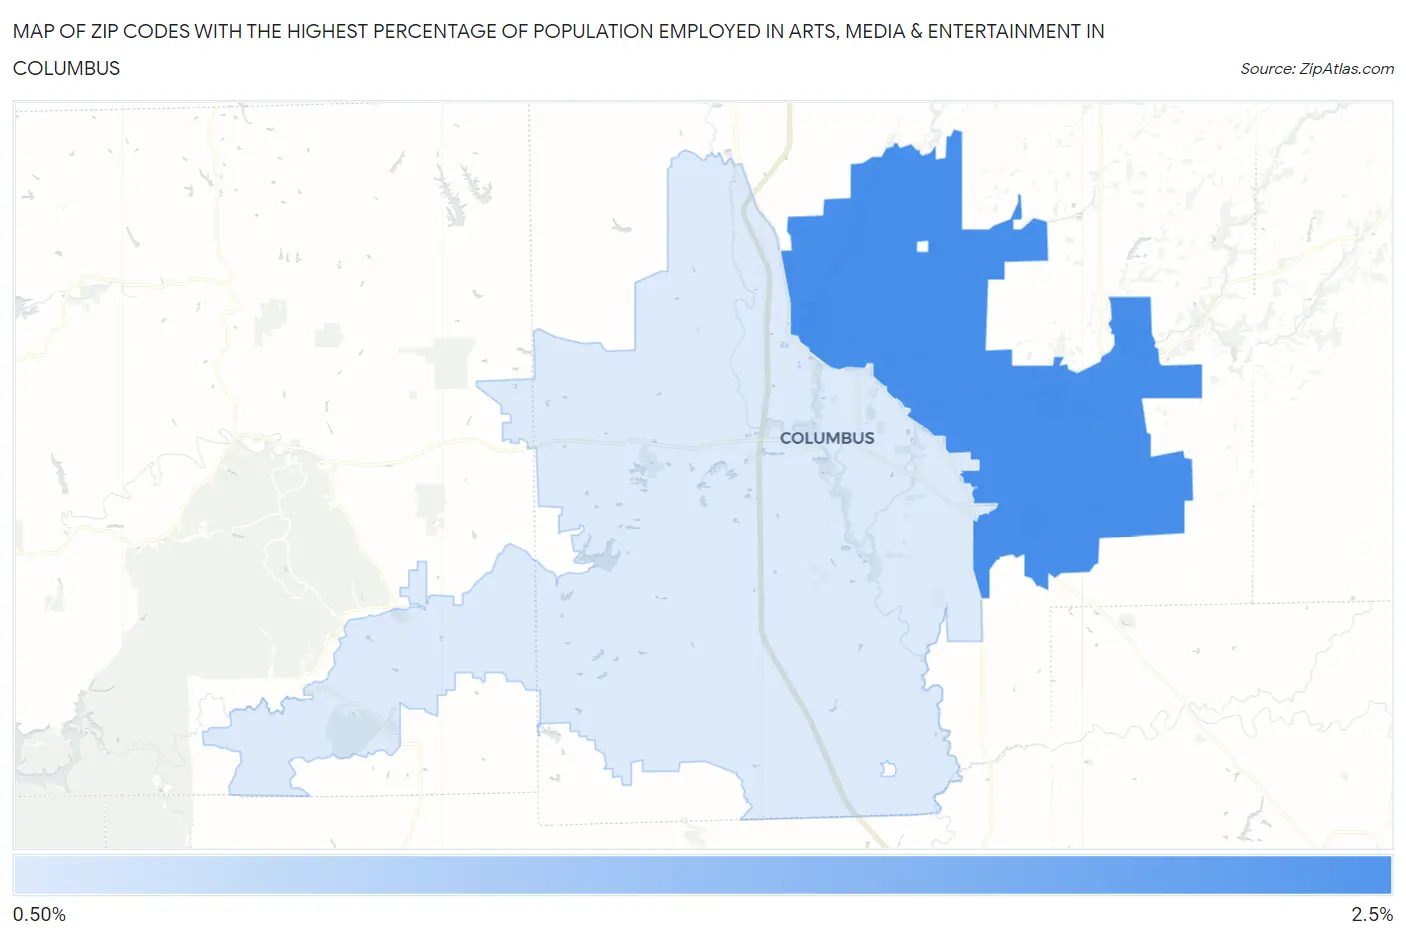
Map of Zip Codes with the Highest Percentage of Population Employed in Arts, Media & Entertainment in Columbus
0.0%
2.5%
Zip Codes with the Highest Percentage of Population Employed in Arts, Media & Entertainment in Columbus, IN
| Zip Code | % Employed | vs State | vs National | |
| 1. | 47203 | 2.2% | 1.4%(+0.767)#105 | 2.1%(+0.119)#6,916 |
| 2. | 47201 | 1.4% | 1.4%(+0.019)#197 | 2.1%(-0.630)#11,482 |
1
Common Questions
What are the Top Zip Codes with the Highest Percentage of Population Employed in Arts, Media & Entertainment in Columbus, IN?
Top Zip Codes with the Highest Percentage of Population Employed in Arts, Media & Entertainment in Columbus, IN are:
What zip code has the Highest Percentage of Population Employed in Arts, Media & Entertainment in Columbus, IN?
47203 has the Highest Percentage of Population Employed in Arts, Media & Entertainment in Columbus, IN with 2.2%.
What is the Percentage of Population Employed in Arts, Media & Entertainment in Columbus, IN?
Percentage of Population Employed in Arts, Media & Entertainment in Columbus is 1.8%.
What is the Percentage of Population Employed in Arts, Media & Entertainment in Indiana?
Percentage of Population Employed in Arts, Media & Entertainment in Indiana is 1.4%.
What is the Percentage of Population Employed in Arts, Media & Entertainment in the United States?
Percentage of Population Employed in Arts, Media & Entertainment in the United States is 2.1%.