Vietnamese vs Tongan Married-couple Households
COMPARE
Vietnamese
Tongan
Married-couple Households
Married-couple Households Comparison
Vietnamese
Tongans
43.6%
MARRIED-COUPLE HOUSEHOLDS
0.2/ 100
METRIC RATING
262nd/ 347
METRIC RANK
51.6%
MARRIED-COUPLE HOUSEHOLDS
100.0/ 100
METRIC RATING
5th/ 347
METRIC RANK
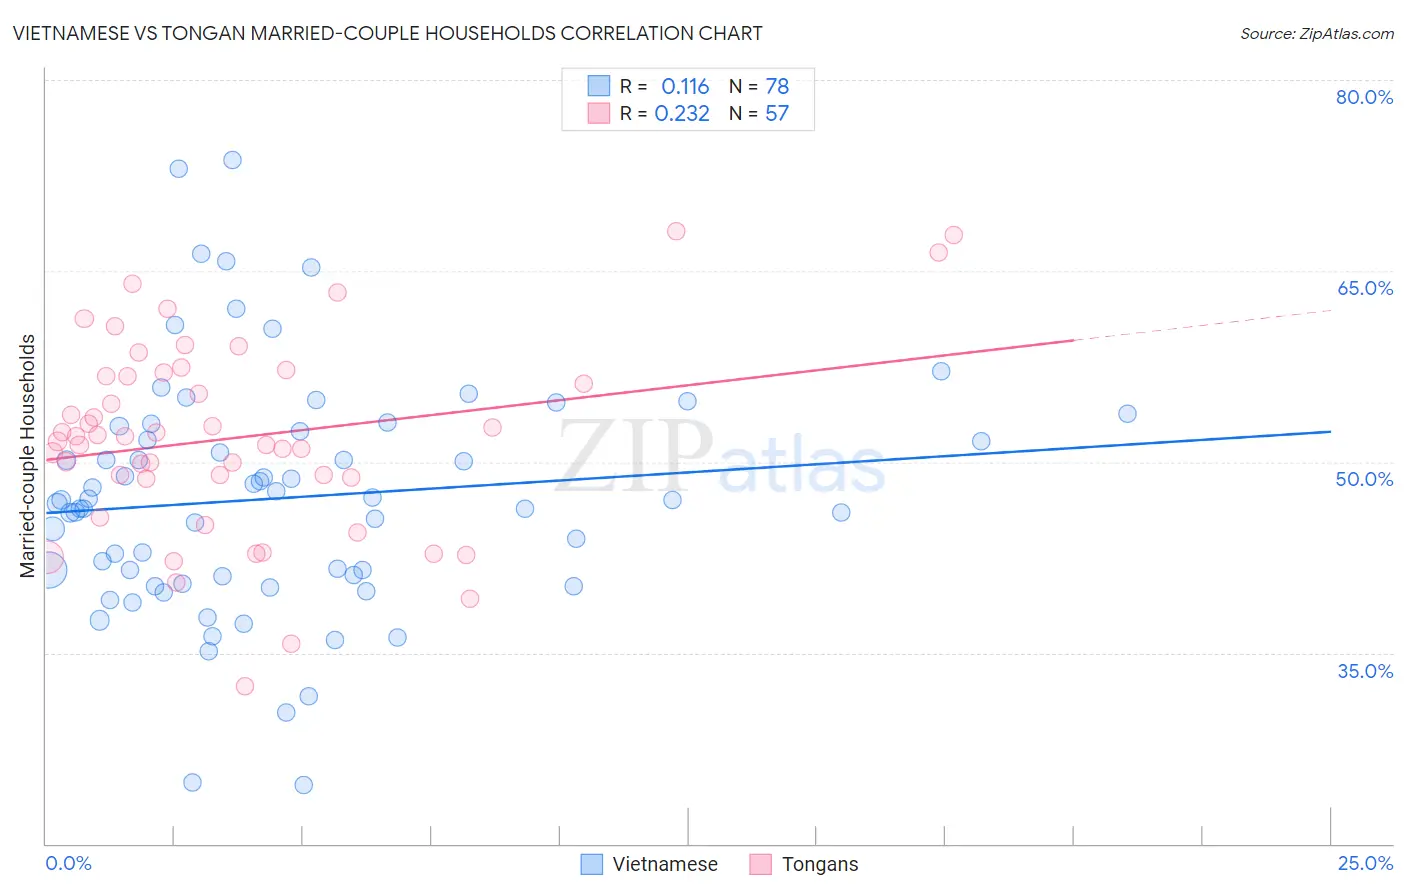
Vietnamese vs Tongan Married-couple Households Correlation Chart
The statistical analysis conducted on geographies consisting of 170,654,128 people shows a poor positive correlation between the proportion of Vietnamese and percentage of married-couple family households in the United States with a correlation coefficient (R) of 0.116 and weighted average of 43.6%. Similarly, the statistical analysis conducted on geographies consisting of 102,869,310 people shows a weak positive correlation between the proportion of Tongans and percentage of married-couple family households in the United States with a correlation coefficient (R) of 0.232 and weighted average of 51.6%, a difference of 18.2%.
Married-couple Households Correlation Summary
| Measurement | Vietnamese | Tongan |
| Minimum | 24.7% | 32.3% |
| Maximum | 73.8% | 68.1% |
| Range | 49.1% | 35.8% |
| Mean | 47.2% | 51.9% |
| Median | 46.9% | 52.0% |
| Interquartile 25% (IQ1) | 41.0% | 48.7% |
| Interquartile 75% (IQ3) | 52.4% | 56.9% |
| Interquartile Range (IQR) | 11.4% | 8.2% |
| Standard Deviation (Sample) | 9.4% | 7.6% |
| Standard Deviation (Population) | 9.3% | 7.6% |
Similar Demographics by Married-couple Households
Demographics Similar to Vietnamese by Married-couple Households
In terms of married-couple households, the demographic groups most similar to Vietnamese are Alaskan Athabascan (43.6%, a difference of 0.060%), Cree (43.6%, a difference of 0.11%), Immigrants from Cameroon (43.7%, a difference of 0.19%), Bangladeshi (43.5%, a difference of 0.22%), and Iroquois (43.7%, a difference of 0.28%).
| Demographics | Rating | Rank | Married-couple Households |
| Shoshone | 0.3 /100 | #255 | Tragic 43.9% |
| Ugandans | 0.3 /100 | #256 | Tragic 43.8% |
| Blackfeet | 0.2 /100 | #257 | Tragic 43.8% |
| Central American Indians | 0.2 /100 | #258 | Tragic 43.8% |
| Iroquois | 0.2 /100 | #259 | Tragic 43.7% |
| Immigrants | Cameroon | 0.2 /100 | #260 | Tragic 43.7% |
| Alaskan Athabascans | 0.2 /100 | #261 | Tragic 43.6% |
| Vietnamese | 0.2 /100 | #262 | Tragic 43.6% |
| Cree | 0.1 /100 | #263 | Tragic 43.6% |
| Bangladeshis | 0.1 /100 | #264 | Tragic 43.5% |
| Moroccans | 0.1 /100 | #265 | Tragic 43.5% |
| Ecuadorians | 0.1 /100 | #266 | Tragic 43.5% |
| Natives/Alaskans | 0.1 /100 | #267 | Tragic 43.5% |
| Immigrants | Burma/Myanmar | 0.1 /100 | #268 | Tragic 43.4% |
| Immigrants | Sierra Leone | 0.1 /100 | #269 | Tragic 43.3% |
Demographics Similar to Tongans by Married-couple Households
In terms of married-couple households, the demographic groups most similar to Tongans are Assyrian/Chaldean/Syriac (51.8%, a difference of 0.48%), Thai (51.9%, a difference of 0.68%), Danish (51.1%, a difference of 0.98%), Filipino (51.0%, a difference of 1.2%), and Immigrants from Taiwan (52.4%, a difference of 1.7%).
| Demographics | Rating | Rank | Married-couple Households |
| Immigrants | India | 100.0 /100 | #1 | Exceptional 52.7% |
| Immigrants | Taiwan | 100.0 /100 | #2 | Exceptional 52.4% |
| Thais | 100.0 /100 | #3 | Exceptional 51.9% |
| Assyrians/Chaldeans/Syriacs | 100.0 /100 | #4 | Exceptional 51.8% |
| Tongans | 100.0 /100 | #5 | Exceptional 51.6% |
| Danes | 100.0 /100 | #6 | Exceptional 51.1% |
| Filipinos | 100.0 /100 | #7 | Exceptional 51.0% |
| Immigrants | South Central Asia | 100.0 /100 | #8 | Exceptional 50.6% |
| Pennsylvania Germans | 100.0 /100 | #9 | Exceptional 50.4% |
| Chinese | 100.0 /100 | #10 | Exceptional 50.4% |
| Immigrants | Pakistan | 100.0 /100 | #11 | Exceptional 50.1% |
| Swiss | 100.0 /100 | #12 | Exceptional 49.9% |
| Immigrants | Korea | 100.0 /100 | #13 | Exceptional 49.9% |
| Burmese | 100.0 /100 | #14 | Exceptional 49.8% |
| Koreans | 99.9 /100 | #15 | Exceptional 49.7% |