Immigrants from Ukraine vs Immigrants from Bolivia Married-couple Households

COMPARE

Immigrants from Ukraine
Race
Ancestry
AfghanAfricanAlaska NativeAlaskan AthabascanAlbanianAleutAlsatianAmericanApacheArabArapahoArgentineanArmenianAssyrian/Chaldean/SyriacAustralianAustrianBahamianBangladeshiBarbadianBasqueBelgianBelizeanBermudanBhutaneseBlackfeetBolivianBrazilianBritishBritish West IndianBulgarianBurmeseCajunCambodianCanadianCape VerdeanCarpatho RusynCelticCentral AmericanCentral American IndianCherokeeCheyenneChickasawChileanChineseChippewaChoctawColombianColvilleComancheCosta RicanCreeCreekCroatianCrowCubanCypriotCzechCzechoslovakianDanishDelawareDominicanDutchDutch West IndianEastern EuropeanEcuadorianEgyptianEnglishEstonianEthiopianEuropeanFijianFilipinoFinnishFrenchFrench American IndianFrench CanadianGermanGerman RussianGhanaianGreekGuamanian/ChamorroGuatemalanGuyaneseHaitianHmongHonduranHopiHoumaHungarianIcelanderIndian (Asian)IndonesianInupiatIranianIraqiIrishIroquoisIsraeliItalianJamaicanJapaneseJordanianKenyanKiowaKoreanLaotianLatvianLebaneseLiberianLithuanianLumbeeLuxembourgerMacedonianMalaysianMalteseMarshalleseMenomineeMexicanMexican American IndianMongolianMoroccanNative HawaiianNavajoNepaleseNew ZealanderNicaraguanNigerianNorthern EuropeanNorwegianOkinawanOsageOttawaPaiutePakistaniPalestinianPanamanianParaguayanPennsylvania GermanPeruvianPimaPolishPortuguesePotawatomiPuebloPuerto RicanPuget Sound SalishRomanianRussianSalvadoranSamoanScandinavianScotch-IrishScottishSeminoleSenegaleseSerbianShoshoneSierra LeoneanSiouxSlavicSlovakSloveneSomaliSouth AfricanSouth AmericanSouth American IndianSoviet UnionSpaniardSpanishSpanish AmericanSpanish American IndianSri LankanSubsaharan AfricanSudaneseSwedishSwissSyrianTaiwaneseThaiTlingit-HaidaTohono O'OdhamTonganTrinidadian and TobagonianTsimshianTurkishU.S. Virgin IslanderUgandanUkrainianUruguayanUteVenezuelanVietnameseWelshWest IndianYakamaYaquiYugoslavianYumanYup'ikZimbabwean
Immigration
NonimmigrantsImmigrantsAfghanistanAfricaAlbaniaArgentinaArmeniaAsiaAustraliaAustriaBahamasBangladeshBarbadosBelarusBelgiumBelizeBosnia and HerzegovinaBrazilBulgariaBurma/MyanmarCabo VerdeCambodiaCameroonCanadaCaribbeanCentral AmericaChileChinaColombiaCongoCosta RicaCroatiaCubaCzechoslovakiaDenmarkDominicaDominican RepublicEastern AfricaEastern AsiaEastern EuropeEcuadorEgyptEl SalvadorEnglandEritreaEthiopiaEuropeFijiFranceGermanyGhanaGreeceGrenadaGuatemalaGuyanaHaitiHondurasHong KongHungaryIndiaIndonesiaIranIraqIrelandIsraelItalyJamaicaJapanJordanKazakhstanKenyaKoreaKuwaitLaosLatin AmericaLatviaLebanonLiberiaLithuaniaMalaysiaMexicoMicronesiaMiddle AfricaMoldovaMoroccoNepalNetherlandsNicaraguaNigeriaNorth AmericaNorth MacedoniaNorthern AfricaNorthern EuropeNorwayOceaniaPakistanPanamaPeruPhilippinesPolandPortugalRomaniaRussiaSaudi ArabiaScotlandSenegalSerbiaSierra LeoneSingaporeSomaliaSouth AfricaSouth AmericaSouth Central AsiaSouth Eastern AsiaSouthern EuropeSpainSri LankaSt. Vincent and the GrenadinesSudanSwedenSwitzerlandSyriaTaiwanThailandTrinidad and TobagoTurkeyUgandaUkraineUruguayUzbekistanVenezuelaVietnamWest IndiesWestern AfricaWestern AsiaWestern EuropeYemenZaireZimbabweAzores
Immigrants from Bolivia
Race
Ancestry
AfghanAfricanAlaska NativeAlaskan AthabascanAlbanianAleutAlsatianAmericanApacheArabArapahoArgentineanArmenianAssyrian/Chaldean/SyriacAustralianAustrianBahamianBangladeshiBarbadianBasqueBelgianBelizeanBermudanBhutaneseBlackfeetBolivianBrazilianBritishBritish West IndianBulgarianBurmeseCajunCambodianCanadianCape VerdeanCarpatho RusynCelticCentral AmericanCentral American IndianCherokeeCheyenneChickasawChileanChineseChippewaChoctawColombianColvilleComancheCosta RicanCreeCreekCroatianCrowCubanCypriotCzechCzechoslovakianDanishDelawareDominicanDutchDutch West IndianEastern EuropeanEcuadorianEgyptianEnglishEstonianEthiopianEuropeanFijianFilipinoFinnishFrenchFrench American IndianFrench CanadianGermanGerman RussianGhanaianGreekGuamanian/ChamorroGuatemalanGuyaneseHaitianHmongHonduranHopiHoumaHungarianIcelanderIndian (Asian)IndonesianInupiatIranianIraqiIrishIroquoisIsraeliItalianJamaicanJapaneseJordanianKenyanKiowaKoreanLaotianLatvianLebaneseLiberianLithuanianLumbeeLuxembourgerMacedonianMalaysianMalteseMarshalleseMenomineeMexicanMexican American IndianMongolianMoroccanNative HawaiianNavajoNepaleseNew ZealanderNicaraguanNigerianNorthern EuropeanNorwegianOkinawanOsageOttawaPaiutePakistaniPalestinianPanamanianParaguayanPennsylvania GermanPeruvianPimaPolishPortuguesePotawatomiPuebloPuerto RicanPuget Sound SalishRomanianRussianSalvadoranSamoanScandinavianScotch-IrishScottishSeminoleSenegaleseSerbianShoshoneSierra LeoneanSiouxSlavicSlovakSloveneSomaliSouth AfricanSouth AmericanSouth American IndianSoviet UnionSpaniardSpanishSpanish AmericanSpanish American IndianSri LankanSubsaharan AfricanSudaneseSwedishSwissSyrianTaiwaneseThaiTlingit-HaidaTohono O'OdhamTonganTrinidadian and TobagonianTsimshianTurkishU.S. Virgin IslanderUgandanUkrainianUruguayanUteVenezuelanVietnameseWelshWest IndianYakamaYaquiYugoslavianYumanYup'ikZimbabwean
Immigration
NonimmigrantsImmigrantsAfghanistanAfricaAlbaniaArgentinaArmeniaAsiaAustraliaAustriaBahamasBangladeshBarbadosBelarusBelgiumBelizeBoliviaBosnia and HerzegovinaBrazilBulgariaBurma/MyanmarCabo VerdeCambodiaCameroonCanadaCaribbeanCentral AmericaChileChinaColombiaCongoCosta RicaCroatiaCubaCzechoslovakiaDenmarkDominicaDominican RepublicEastern AfricaEastern AsiaEastern EuropeEcuadorEgyptEl SalvadorEnglandEritreaEthiopiaEuropeFijiFranceGermanyGhanaGreeceGrenadaGuatemalaGuyanaHaitiHondurasHong KongHungaryIndiaIndonesiaIranIraqIrelandIsraelItalyJamaicaJapanJordanKazakhstanKenyaKoreaKuwaitLaosLatin AmericaLatviaLebanonLiberiaLithuaniaMalaysiaMexicoMicronesiaMiddle AfricaMoldovaMoroccoNepalNetherlandsNicaraguaNigeriaNorth AmericaNorth MacedoniaNorthern AfricaNorthern EuropeNorwayOceaniaPakistanPanamaPeruPhilippinesPolandPortugalRomaniaRussiaSaudi ArabiaScotlandSenegalSerbiaSierra LeoneSingaporeSomaliaSouth AfricaSouth AmericaSouth Central AsiaSouth Eastern AsiaSouthern EuropeSpainSri LankaSt. Vincent and the GrenadinesSudanSwedenSwitzerlandSyriaTaiwanThailandTrinidad and TobagoTurkeyUgandaUruguayUzbekistanVenezuelaVietnamWest IndiesWestern AfricaWestern AsiaWestern EuropeYemenZaireZimbabweAzores
Married-couple Households
Income
Poverty
Unemployment
Labor Participation
Family Structure
Vehicle Availability
Education Level
Disability

Married-couple Households Comparison

Immigrants from Ukraine

Immigrants from Bolivia

Excellent
Exceptional
47.3%
MARRIED-COUPLE HOUSEHOLDS
86.7/ 100
METRIC RATING
132nd/ 347
METRIC RANK
48.9%
MARRIED-COUPLE HOUSEHOLDS
99.6/ 100
METRIC RATING
40th/ 347
METRIC RANK

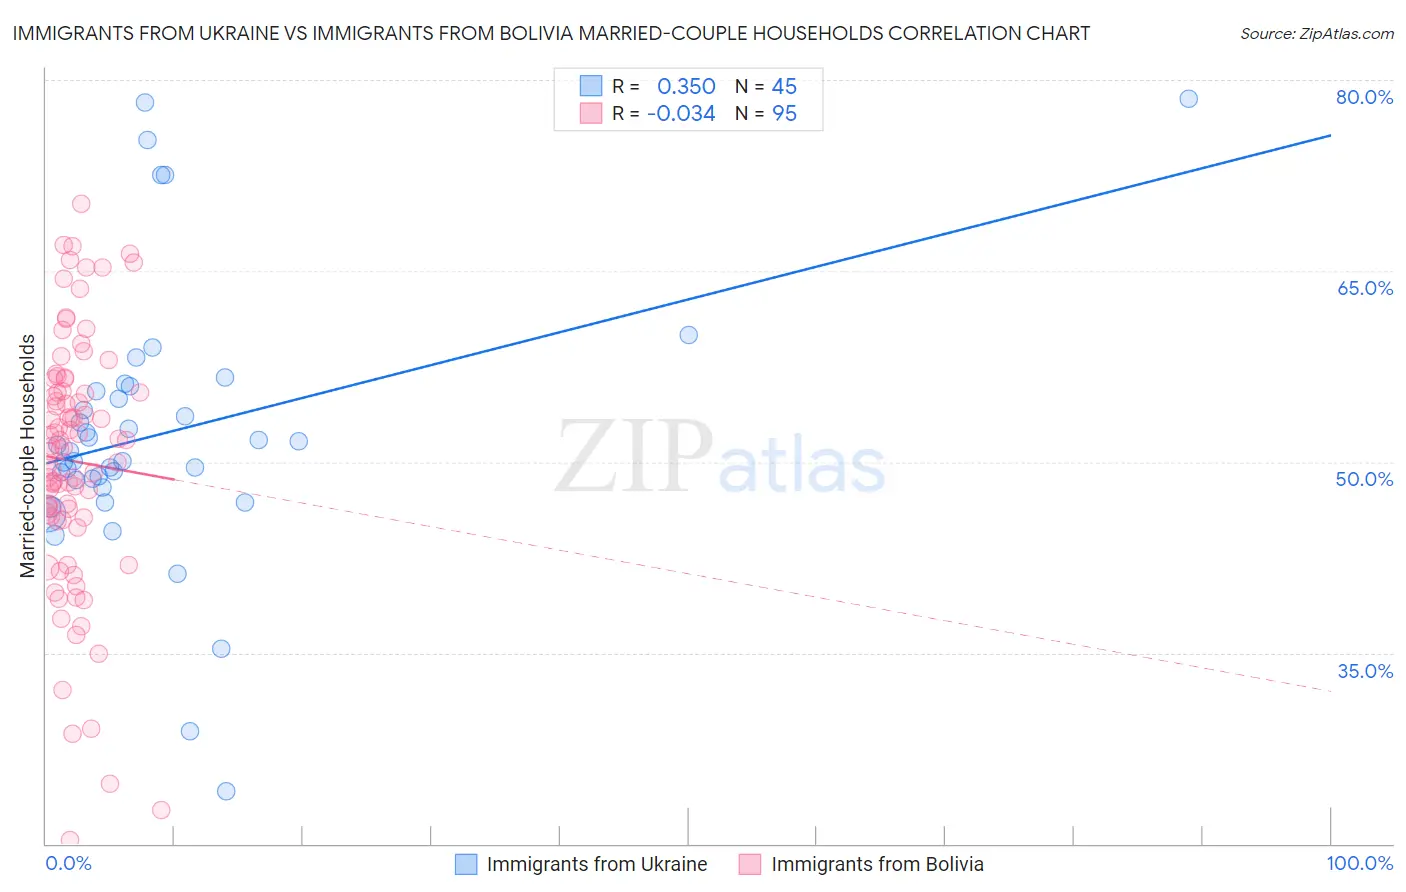
Immigrants from Ukraine vs Immigrants from Bolivia Married-couple Households Correlation Chart

The statistical analysis conducted on geographies consisting of 289,643,450 people shows a mild positive correlation between the proportion of Immigrants from Ukraine and percentage of married-couple family households in the United States with a correlation coefficient (R) of 0.350 and weighted average of 47.3%. Similarly, the statistical analysis conducted on geographies consisting of 158,720,883 people shows no correlation between the proportion of Immigrants from Bolivia and percentage of married-couple family households in the United States with a correlation coefficient (R) of -0.034 and weighted average of 48.9%, a difference of 3.4%.
Immigrants from Ukraine vs Immigrants from Bolivia Married-couple Households

Married-couple Households Correlation Summary

MeasurementImmigrants from UkraineImmigrants from Bolivia
Minimum24.1%20.3%
Maximum78.6%70.3%
Range54.4%50.0%
Mean52.3%50.1%
Median50.8%51.1%
Interquartile 25% (IQ1)48.3%45.6%
Interquartile 75% (IQ3)55.7%55.5%
Interquartile Range (IQR)7.5%9.9%
Standard Deviation (Sample)10.7%9.9%
Standard Deviation (Population)10.6%9.9%

Similar Demographics by Married-couple Households

Demographics Similar to Immigrants from Ukraine by Married-couple Households

In terms of married-couple households, the demographic groups most similar to Immigrants from Ukraine are South African (47.3%, a difference of 0.020%), Immigrants from Greece (47.2%, a difference of 0.060%), Immigrants from Argentina (47.2%, a difference of 0.060%), Immigrants from Denmark (47.3%, a difference of 0.070%), and Immigrants from Iraq (47.3%, a difference of 0.090%).
DemographicsRating | RankMarried-couple Households
Australians
89.0
/100
|
#125
Excellent
47.4%
Pakistanis
88.6
/100
|
#126
Excellent
47.3%
Celtics
88.1
/100
|
#127
Excellent
47.3%
Immigrants | Peru
87.9
/100
|
#128
Excellent
47.3%
Immigrants | Iraq
87.8
/100
|
#129
Excellent
47.3%
Immigrants | Hungary
87.8
/100
|
#130
Excellent
47.3%
Immigrants | Denmark
87.5
/100
|
#131
Excellent
47.3%
Immigrants | Ukraine
86.7
/100
|
#132
Excellent
47.3%
South Africans
86.4
/100
|
#133
Excellent
47.3%
Immigrants | Greece
86.0
/100
|
#134
Excellent
47.2%
Immigrants | Argentina
86.0
/100
|
#135
Excellent
47.2%
New Zealanders
85.3
/100
|
#136
Excellent
47.2%
Immigrants | Malaysia
85.2
/100
|
#137
Excellent
47.2%
Immigrants | Afghanistan
85.1
/100
|
#138
Excellent
47.2%
Immigrants | Sweden
84.7
/100
|
#139
Excellent
47.2%

Demographics Similar to Immigrants from Bolivia by Married-couple Households

In terms of married-couple households, the demographic groups most similar to Immigrants from Bolivia are Lithuanian (48.9%, a difference of 0.010%), Immigrants from Lebanon (48.9%, a difference of 0.030%), Immigrants from Vietnam (48.8%, a difference of 0.080%), Greek (48.9%, a difference of 0.10%), and Immigrants from Iran (48.8%, a difference of 0.14%).
DemographicsRating | RankMarried-couple Households
Immigrants | Asia
99.7
/100
|
#33
Exceptional
49.1%
Italians
99.7
/100
|
#34
Exceptional
49.0%
Scottish
99.7
/100
|
#35
Exceptional
49.0%
Iranians
99.7
/100
|
#36
Exceptional
49.0%
Sri Lankans
99.7
/100
|
#37
Exceptional
49.0%
Greeks
99.7
/100
|
#38
Exceptional
48.9%
Lithuanians
99.6
/100
|
#39
Exceptional
48.9%
Immigrants | Bolivia
99.6
/100
|
#40
Exceptional
48.9%
Immigrants | Lebanon
99.6
/100
|
#41
Exceptional
48.9%
Immigrants | Vietnam
99.6
/100
|
#42
Exceptional
48.8%
Immigrants | Iran
99.6
/100
|
#43
Exceptional
48.8%
Welsh
99.5
/100
|
#44
Exceptional
48.8%
Immigrants | Eastern Asia
99.5
/100
|
#45
Exceptional
48.8%
Tsimshian
99.5
/100
|
#46
Exceptional
48.7%
British
99.5
/100
|
#47
Exceptional
48.7%