Macedonian vs Immigrants from Eastern Africa GED/Equivalency
COMPARE
Macedonian
Immigrants from Eastern Africa
GED/Equivalency
GED/Equivalency Comparison
Macedonians
Immigrants from Eastern Africa
88.1%
GED/EQUIVALENCY
99.5/ 100
METRIC RATING
44th/ 347
METRIC RANK
85.7%
GED/EQUIVALENCY
47.7/ 100
METRIC RATING
176th/ 347
METRIC RANK
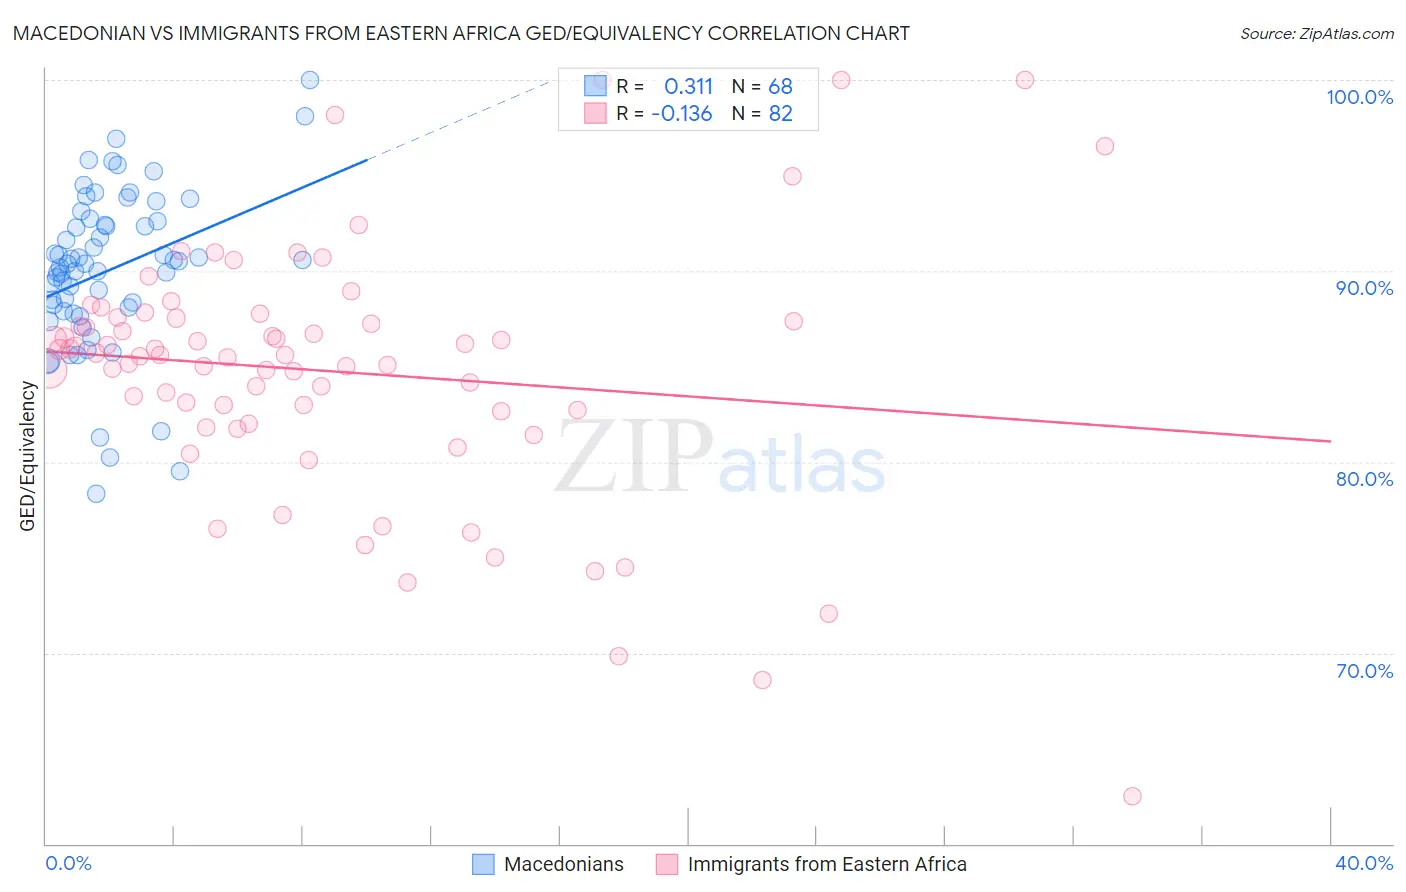
Macedonian vs Immigrants from Eastern Africa GED/Equivalency Correlation Chart
The statistical analysis conducted on geographies consisting of 132,657,099 people shows a mild positive correlation between the proportion of Macedonians and percentage of population with at least ged/equivalency education in the United States with a correlation coefficient (R) of 0.311 and weighted average of 88.1%. Similarly, the statistical analysis conducted on geographies consisting of 355,153,076 people shows a poor negative correlation between the proportion of Immigrants from Eastern Africa and percentage of population with at least ged/equivalency education in the United States with a correlation coefficient (R) of -0.136 and weighted average of 85.7%, a difference of 2.8%.
GED/Equivalency Correlation Summary
| Measurement | Macedonian | Immigrants from Eastern Africa |
| Minimum | 78.4% | 62.5% |
| Maximum | 100.0% | 100.0% |
| Range | 21.6% | 37.5% |
| Mean | 90.0% | 84.7% |
| Median | 90.4% | 85.6% |
| Interquartile 25% (IQ1) | 88.0% | 82.7% |
| Interquartile 75% (IQ3) | 92.5% | 87.5% |
| Interquartile Range (IQR) | 4.5% | 4.9% |
| Standard Deviation (Sample) | 4.2% | 6.6% |
| Standard Deviation (Population) | 4.2% | 6.6% |
Similar Demographics by GED/Equivalency
Demographics Similar to Macedonians by GED/Equivalency
In terms of ged/equivalency, the demographic groups most similar to Macedonians are Immigrants from Scotland (88.2%, a difference of 0.030%), Cambodian (88.2%, a difference of 0.040%), Czech (88.1%, a difference of 0.040%), Immigrants from Switzerland (88.1%, a difference of 0.050%), and Finnish (88.2%, a difference of 0.060%).
| Demographics | Rating | Rank | GED/Equivalency |
| Immigrants | Austria | 99.7 /100 | #37 | Exceptional 88.3% |
| Burmese | 99.7 /100 | #38 | Exceptional 88.3% |
| Immigrants | Israel | 99.6 /100 | #39 | Exceptional 88.2% |
| Italians | 99.6 /100 | #40 | Exceptional 88.2% |
| Finns | 99.6 /100 | #41 | Exceptional 88.2% |
| Cambodians | 99.6 /100 | #42 | Exceptional 88.2% |
| Immigrants | Scotland | 99.6 /100 | #43 | Exceptional 88.2% |
| Macedonians | 99.5 /100 | #44 | Exceptional 88.1% |
| Czechs | 99.5 /100 | #45 | Exceptional 88.1% |
| Immigrants | Switzerland | 99.5 /100 | #46 | Exceptional 88.1% |
| Immigrants | Latvia | 99.5 /100 | #47 | Exceptional 88.1% |
| Greeks | 99.5 /100 | #48 | Exceptional 88.1% |
| Australians | 99.5 /100 | #49 | Exceptional 88.1% |
| Immigrants | Korea | 99.5 /100 | #50 | Exceptional 88.1% |
| Immigrants | Netherlands | 99.4 /100 | #51 | Exceptional 88.0% |
Demographics Similar to Immigrants from Eastern Africa by GED/Equivalency
In terms of ged/equivalency, the demographic groups most similar to Immigrants from Eastern Africa are Immigrants from Bolivia (85.8%, a difference of 0.040%), Ottawa (85.8%, a difference of 0.050%), Immigrants from Uganda (85.7%, a difference of 0.050%), Immigrants from Venezuela (85.8%, a difference of 0.060%), and Korean (85.6%, a difference of 0.13%).
| Demographics | Rating | Rank | GED/Equivalency |
| Immigrants | Ethiopia | 61.2 /100 | #169 | Good 86.0% |
| Afghans | 59.7 /100 | #170 | Average 85.9% |
| Immigrants | Chile | 57.3 /100 | #171 | Average 85.9% |
| Bermudans | 55.1 /100 | #172 | Average 85.8% |
| Immigrants | Venezuela | 50.7 /100 | #173 | Average 85.8% |
| Ottawa | 50.0 /100 | #174 | Average 85.8% |
| Immigrants | Bolivia | 49.8 /100 | #175 | Average 85.8% |
| Immigrants | Eastern Africa | 47.7 /100 | #176 | Average 85.7% |
| Immigrants | Uganda | 45.2 /100 | #177 | Average 85.7% |
| Koreans | 41.2 /100 | #178 | Average 85.6% |
| Aleuts | 40.5 /100 | #179 | Average 85.6% |
| Immigrants | Southern Europe | 38.4 /100 | #180 | Fair 85.5% |
| Moroccans | 37.7 /100 | #181 | Fair 85.5% |
| Sudanese | 35.2 /100 | #182 | Fair 85.5% |
| Immigrants | Sudan | 34.2 /100 | #183 | Fair 85.5% |