Immigrants from Haiti vs Cajun Disability
COMPARE
Immigrants from Haiti
Cajun
Disability
Disability Comparison
Immigrants from Haiti
Cajuns
11.7%
DISABILITY
59.2/ 100
METRIC RATING
162nd/ 347
METRIC RANK
14.6%
DISABILITY
0.0/ 100
METRIC RATING
333rd/ 347
METRIC RANK
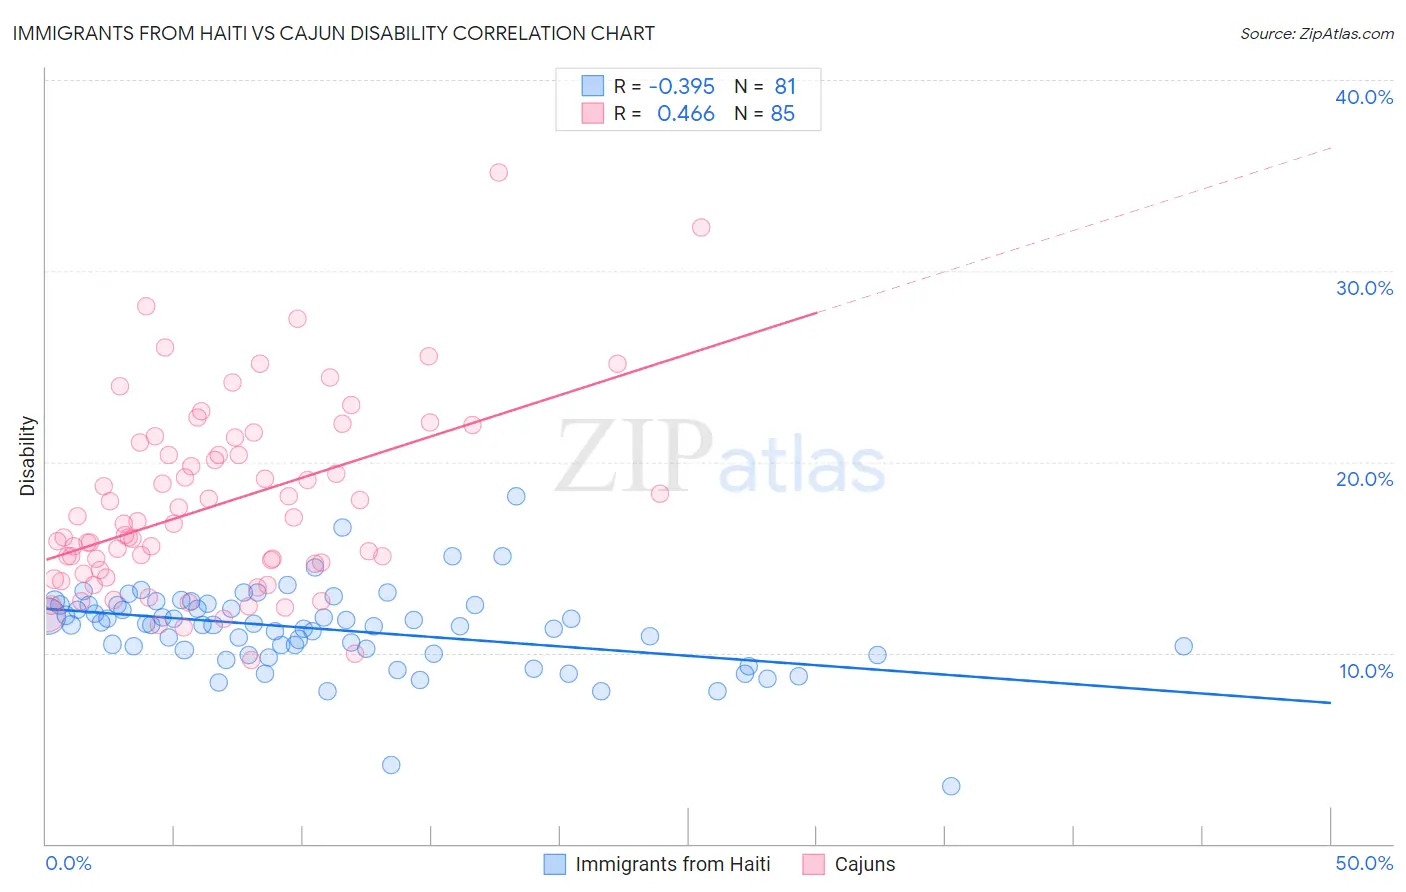
Immigrants from Haiti vs Cajun Disability Correlation Chart
The statistical analysis conducted on geographies consisting of 225,241,384 people shows a mild negative correlation between the proportion of Immigrants from Haiti and percentage of population with a disability in the United States with a correlation coefficient (R) of -0.395 and weighted average of 11.7%. Similarly, the statistical analysis conducted on geographies consisting of 149,702,868 people shows a moderate positive correlation between the proportion of Cajuns and percentage of population with a disability in the United States with a correlation coefficient (R) of 0.466 and weighted average of 14.6%, a difference of 25.3%.
Disability Correlation Summary
| Measurement | Immigrants from Haiti | Cajun |
| Minimum | 3.0% | 9.6% |
| Maximum | 18.2% | 35.2% |
| Range | 15.2% | 25.5% |
| Mean | 11.2% | 17.8% |
| Median | 11.5% | 16.7% |
| Interquartile 25% (IQ1) | 10.1% | 14.3% |
| Interquartile 75% (IQ3) | 12.5% | 20.7% |
| Interquartile Range (IQR) | 2.4% | 6.5% |
| Standard Deviation (Sample) | 2.2% | 4.9% |
| Standard Deviation (Population) | 2.2% | 4.9% |
Similar Demographics by Disability
Demographics Similar to Immigrants from Haiti by Disability
In terms of disability, the demographic groups most similar to Immigrants from Haiti are Immigrants from Trinidad and Tobago (11.7%, a difference of 0.020%), Syrian (11.7%, a difference of 0.030%), Cuban (11.7%, a difference of 0.12%), Immigrants from Cuba (11.6%, a difference of 0.17%), and Pakistani (11.7%, a difference of 0.21%).
| Demographics | Rating | Rank | Disability |
| Immigrants | Netherlands | 69.8 /100 | #155 | Good 11.6% |
| Immigrants | Fiji | 69.5 /100 | #156 | Good 11.6% |
| Immigrants | Middle Africa | 69.5 /100 | #157 | Good 11.6% |
| Armenians | 65.9 /100 | #158 | Good 11.6% |
| Guatemalans | 65.1 /100 | #159 | Good 11.6% |
| Immigrants | Barbados | 64.2 /100 | #160 | Good 11.6% |
| Immigrants | Cuba | 62.8 /100 | #161 | Good 11.6% |
| Immigrants | Haiti | 59.2 /100 | #162 | Average 11.7% |
| Immigrants | Trinidad and Tobago | 58.9 /100 | #163 | Average 11.7% |
| Syrians | 58.5 /100 | #164 | Average 11.7% |
| Cubans | 56.7 /100 | #165 | Average 11.7% |
| Pakistanis | 54.7 /100 | #166 | Average 11.7% |
| Estonians | 54.4 /100 | #167 | Average 11.7% |
| Immigrants | Latin America | 54.1 /100 | #168 | Average 11.7% |
| Immigrants | Austria | 53.4 /100 | #169 | Average 11.7% |
Demographics Similar to Cajuns by Disability
In terms of disability, the demographic groups most similar to Cajuns are Yuman (14.6%, a difference of 0.12%), Pueblo (14.4%, a difference of 1.1%), Alaskan Athabascan (14.4%, a difference of 1.1%), Tohono O'odham (14.8%, a difference of 1.2%), and Cherokee (14.8%, a difference of 1.7%).
| Demographics | Rating | Rank | Disability |
| Osage | 0.0 /100 | #326 | Tragic 14.2% |
| Ottawa | 0.0 /100 | #327 | Tragic 14.2% |
| Immigrants | Azores | 0.0 /100 | #328 | Tragic 14.2% |
| Potawatomi | 0.0 /100 | #329 | Tragic 14.2% |
| Navajo | 0.0 /100 | #330 | Tragic 14.3% |
| Alaskan Athabascans | 0.0 /100 | #331 | Tragic 14.4% |
| Pueblo | 0.0 /100 | #332 | Tragic 14.4% |
| Cajuns | 0.0 /100 | #333 | Tragic 14.6% |
| Yuman | 0.0 /100 | #334 | Tragic 14.6% |
| Tohono O'odham | 0.0 /100 | #335 | Tragic 14.8% |
| Cherokee | 0.0 /100 | #336 | Tragic 14.8% |
| Seminole | 0.0 /100 | #337 | Tragic 14.9% |
| Dutch West Indians | 0.0 /100 | #338 | Tragic 14.9% |
| Chickasaw | 0.0 /100 | #339 | Tragic 15.2% |
| Choctaw | 0.0 /100 | #340 | Tragic 15.4% |