Zip Codes with the Highest Percentage of Population with a Degree in Engineering in Loveland, CO
RELATED REPORTS & OPTIONS
Engineering
Loveland
Compare Zip Codes
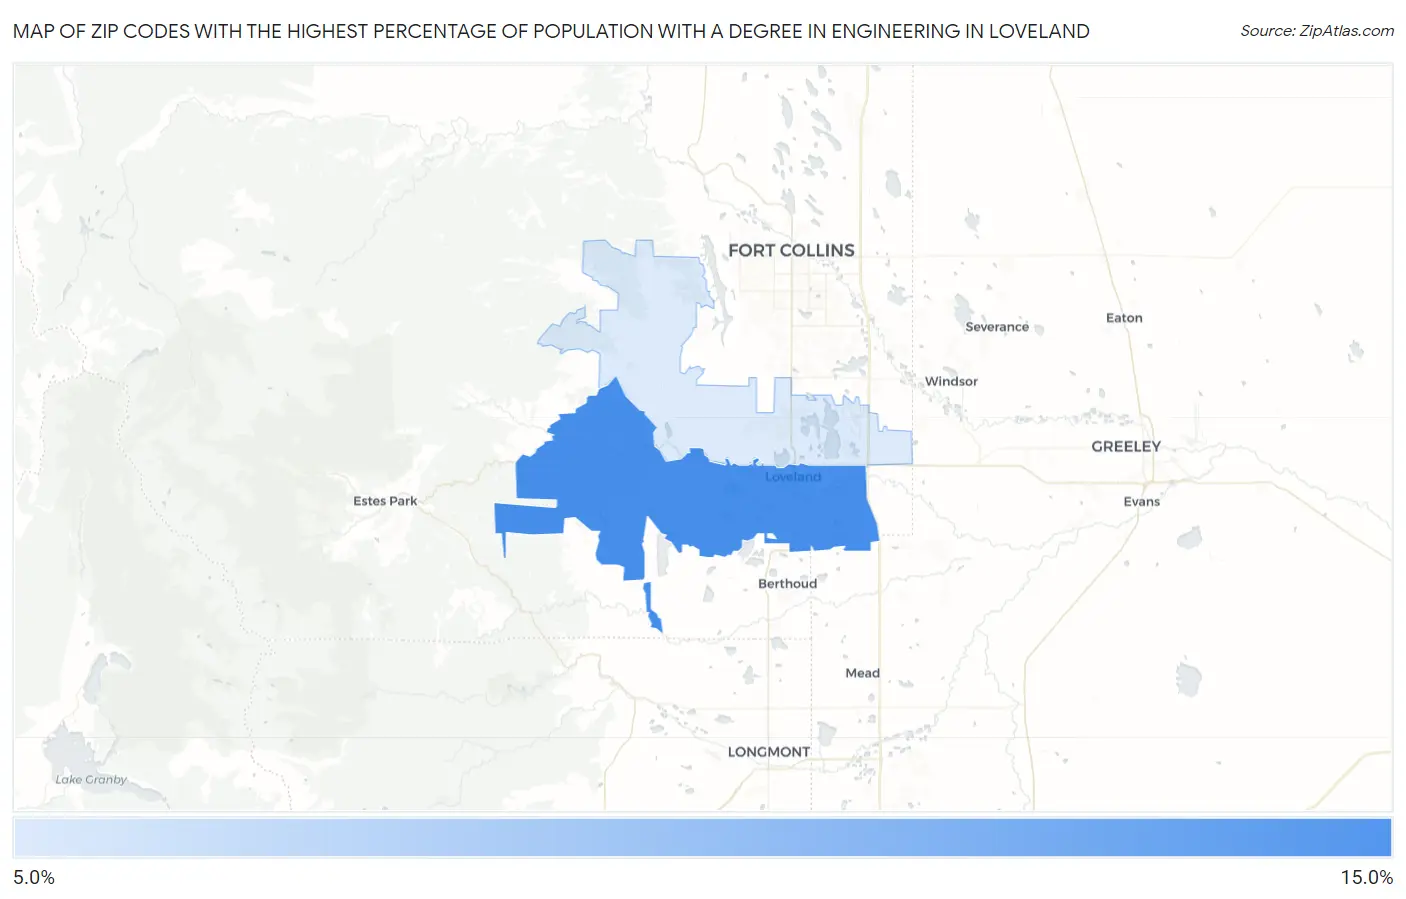
Map of Zip Codes with the Highest Percentage of Population with a Degree in Engineering in Loveland
0.0%
15.0%
Zip Codes with the Highest Percentage of Population with a Degree in Engineering in Loveland, CO
| Zip Code | % Graduates | vs State | vs National | |
| 1. | 80537 | 11.3% | 8.3%(+3.02)#76 | 7.6%(+3.63)#3,342 |
| 2. | 80538 | 8.8% | 8.3%(+0.508)#142 | 7.6%(+1.12)#5,918 |
1
Common Questions
What are the Top Zip Codes with the Highest Percentage of Population with a Degree in Engineering in Loveland, CO?
Top Zip Codes with the Highest Percentage of Population with a Degree in Engineering in Loveland, CO are:
What zip code has the Highest Percentage of Population with a Degree in Engineering in Loveland, CO?
80537 has the Highest Percentage of Population with a Degree in Engineering in Loveland, CO with 11.3%.
What is the Percentage of Population with a Degree in Engineering in Loveland, CO?
Percentage of Population with a Degree in Engineering in Loveland is 9.4%.
What is the Percentage of Population with a Degree in Engineering in Colorado?
Percentage of Population with a Degree in Engineering in Colorado is 8.3%.
What is the Percentage of Population with a Degree in Engineering in the United States?
Percentage of Population with a Degree in Engineering in the United States is 7.6%.