Zip Codes with the Highest Percentage of Population with a Degree in Engineering in Littleton, CO
RELATED REPORTS & OPTIONS
Engineering
Littleton
Compare Zip Codes
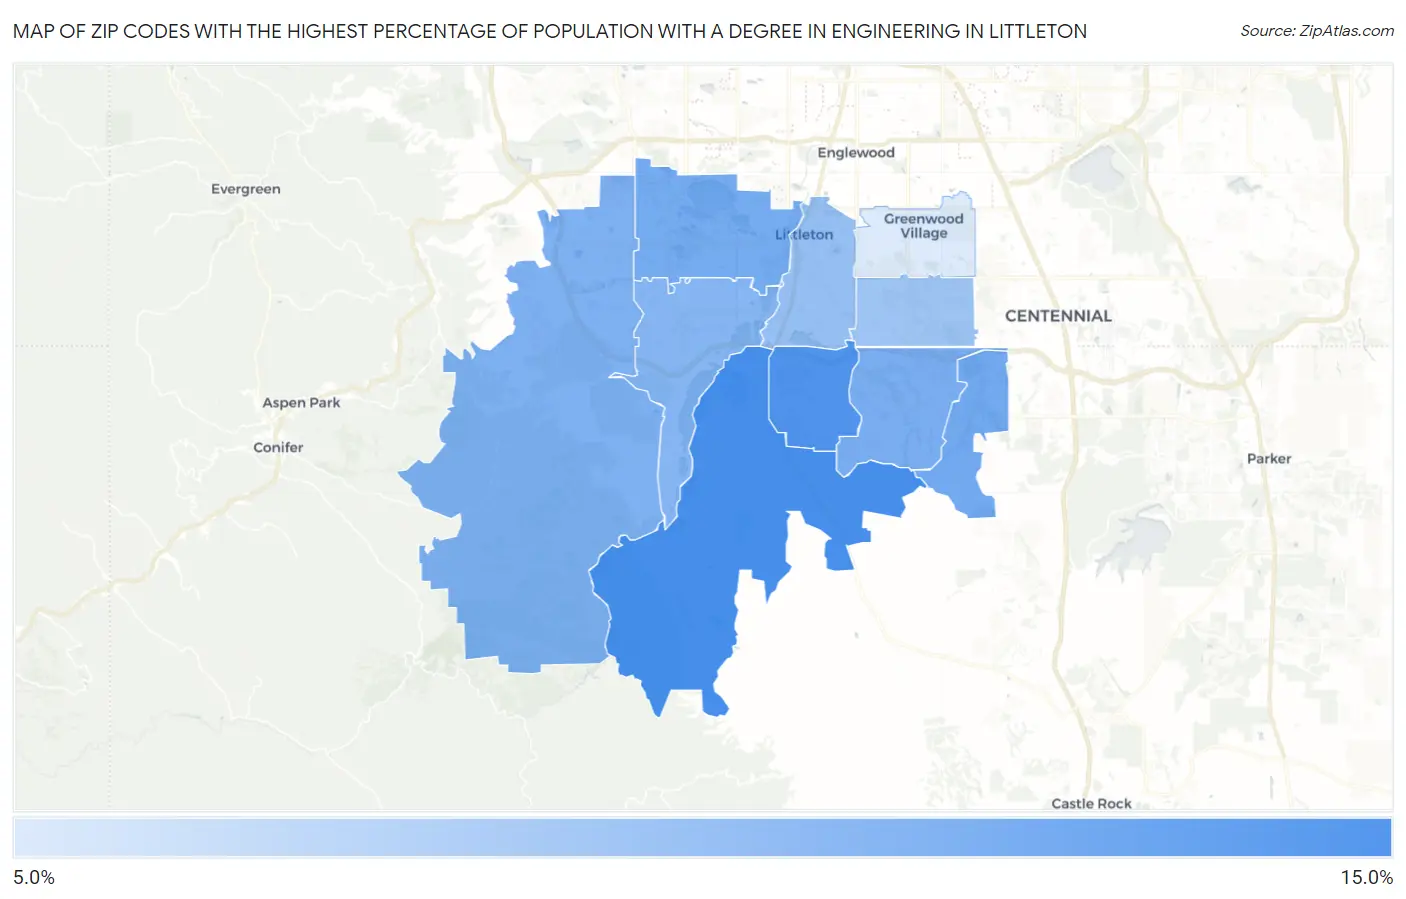
Map of Zip Codes with the Highest Percentage of Population with a Degree in Engineering in Littleton
0.0%
15.0%
Zip Codes with the Highest Percentage of Population with a Degree in Engineering in Littleton, CO
| Zip Code | % Graduates | vs State | vs National | |
| 1. | 80125 | 14.0% | 8.3%(+5.79)#37 | 7.6%(+6.40)#1,998 |
| 2. | 80129 | 13.7% | 8.3%(+5.44)#41 | 7.6%(+6.05)#2,138 |
| 3. | 80130 | 11.5% | 8.3%(+3.22)#71 | 7.6%(+3.84)#3,192 |
| 4. | 80123 | 11.4% | 8.3%(+3.11)#74 | 7.6%(+3.73)#3,271 |
| 5. | 80126 | 11.1% | 8.3%(+2.82)#83 | 7.6%(+3.44)#3,508 |
| 6. | 80127 | 10.8% | 8.3%(+2.55)#88 | 7.6%(+3.16)#3,696 |
| 7. | 80128 | 10.5% | 8.3%(+2.24)#94 | 7.6%(+2.85)#3,978 |
| 8. | 80120 | 9.6% | 8.3%(+1.33)#115 | 7.6%(+1.94)#4,878 |
| 9. | 80122 | 9.0% | 8.3%(+0.771)#132 | 7.6%(+1.38)#5,552 |
| 10. | 80121 | 5.6% | 8.3%(-2.65)#250 | 7.6%(-2.04)#12,184 |
1
Common Questions
What are the Top 5 Zip Codes with the Highest Percentage of Population with a Degree in Engineering in Littleton, CO?
Top 5 Zip Codes with the Highest Percentage of Population with a Degree in Engineering in Littleton, CO are:
What zip code has the Highest Percentage of Population with a Degree in Engineering in Littleton, CO?
80125 has the Highest Percentage of Population with a Degree in Engineering in Littleton, CO with 14.0%.
What is the Percentage of Population with a Degree in Engineering in Littleton, CO?
Percentage of Population with a Degree in Engineering in Littleton is 9.0%.
What is the Percentage of Population with a Degree in Engineering in Colorado?
Percentage of Population with a Degree in Engineering in Colorado is 8.3%.
What is the Percentage of Population with a Degree in Engineering in the United States?
Percentage of Population with a Degree in Engineering in the United States is 7.6%.