Zip Codes with the Highest Percentage of Population Employed in Architecture & Engineering in Castle Rock, CO
RELATED REPORTS & OPTIONS
Architecture & Engineering
Castle Rock
Compare Zip Codes
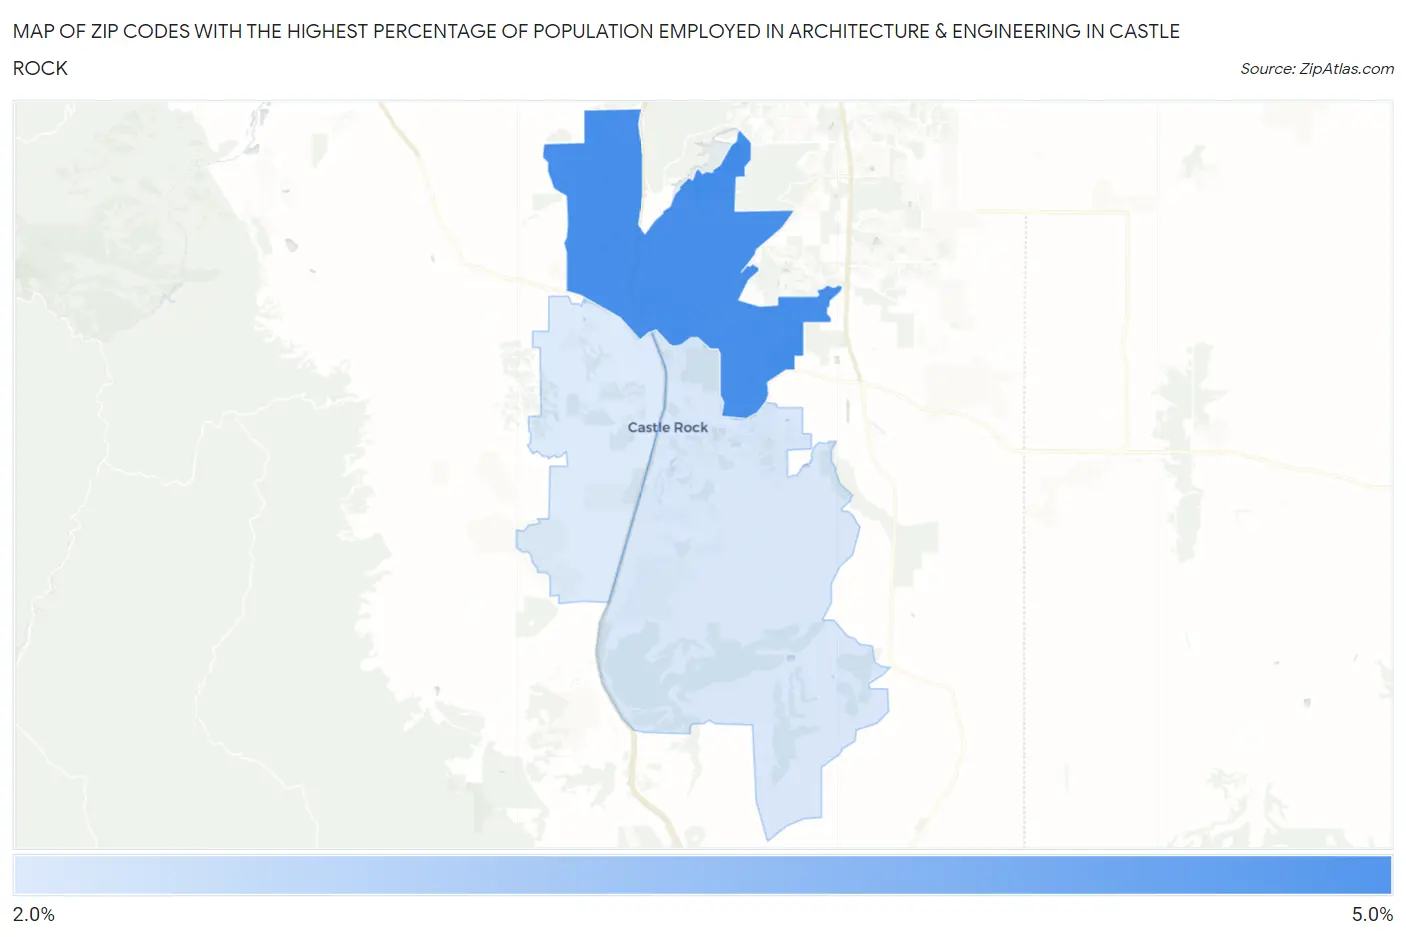
Map of Zip Codes with the Highest Percentage of Population Employed in Architecture & Engineering in Castle Rock
0.0%
5.0%
Zip Codes with the Highest Percentage of Population Employed in Architecture & Engineering in Castle Rock, CO
| Zip Code | % Employed | vs State | vs National | |
| 1. | 80108 | 4.6% | 2.9%(+1.71)#48 | 2.1%(+2.48)#1,999 |
| 2. | 80104 | 2.8% | 2.9%(-0.091)#136 | 2.1%(+0.681)#5,661 |
| 3. | 80109 | 2.8% | 2.9%(-0.137)#140 | 2.1%(+0.636)#5,841 |
1
Common Questions
What are the Top Zip Codes with the Highest Percentage of Population Employed in Architecture & Engineering in Castle Rock, CO?
Top Zip Codes with the Highest Percentage of Population Employed in Architecture & Engineering in Castle Rock, CO are:
What zip code has the Highest Percentage of Population Employed in Architecture & Engineering in Castle Rock, CO?
80108 has the Highest Percentage of Population Employed in Architecture & Engineering in Castle Rock, CO with 4.6%.
What is the Percentage of Population Employed in Architecture & Engineering in Castle Rock, CO?
Percentage of Population Employed in Architecture & Engineering in Castle Rock is 2.7%.
What is the Percentage of Population Employed in Architecture & Engineering in Colorado?
Percentage of Population Employed in Architecture & Engineering in Colorado is 2.9%.
What is the Percentage of Population Employed in Architecture & Engineering in the United States?
Percentage of Population Employed in Architecture & Engineering in the United States is 2.1%.