Zip Codes with the Highest Percentage of Population Employed in Administrative & Support Services in Castle Rock, CO
RELATED REPORTS & OPTIONS
Administrative & Support Services
Castle Rock
Compare Zip Codes
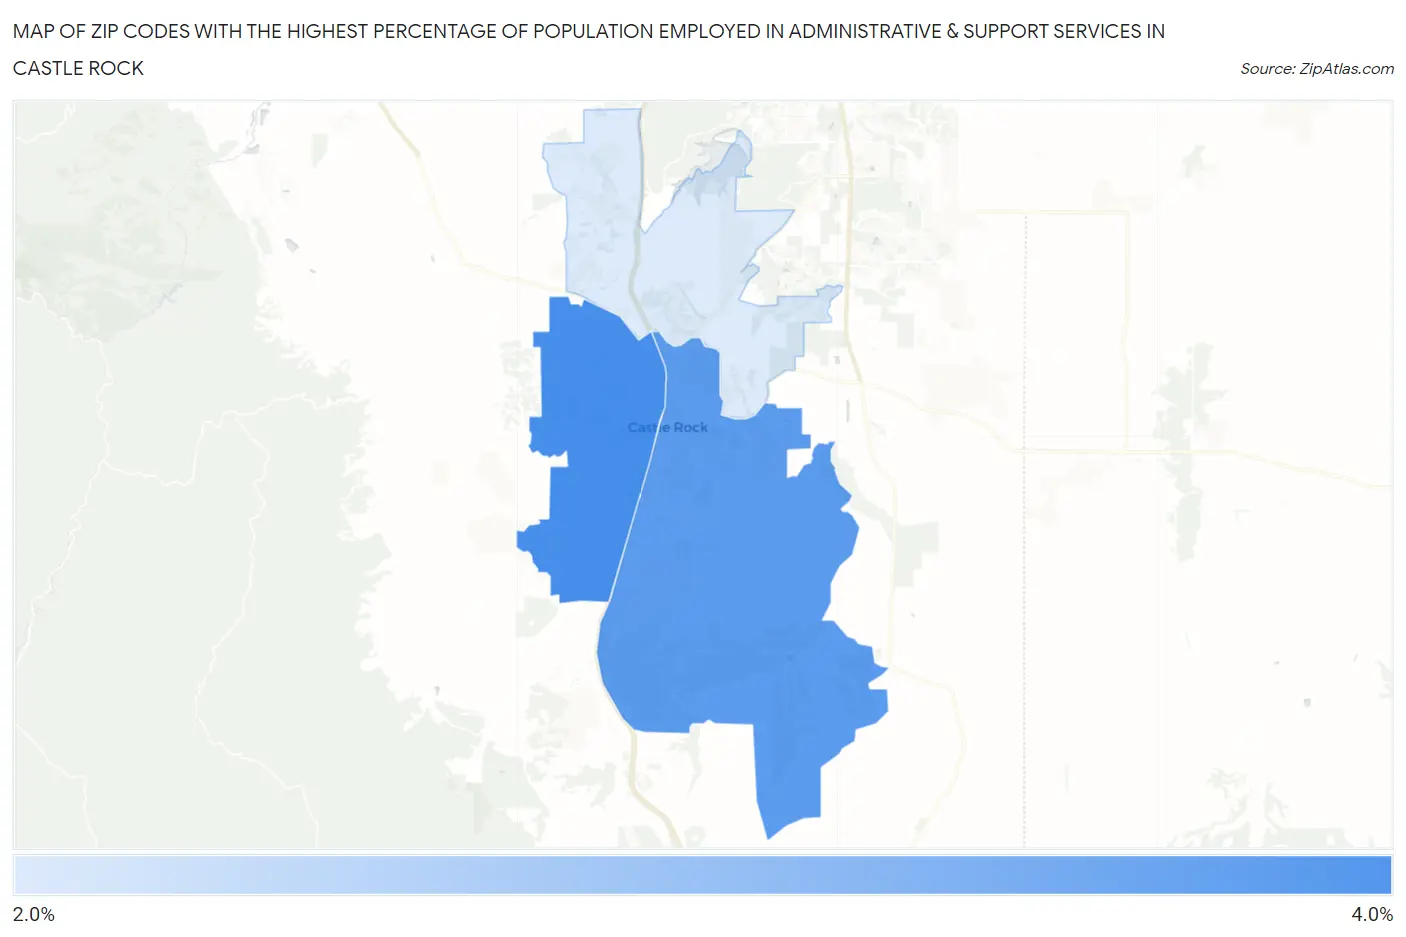
Map of Zip Codes with the Highest Percentage of Population Employed in Administrative & Support Services in Castle Rock
0.0%
4.0%
Zip Codes with the Highest Percentage of Population Employed in Administrative & Support Services in Castle Rock, CO
| Zip Code | % Employed | vs State | vs National | |
| 1. | 80109 | 3.5% | 4.1%(-0.571)#198 | 4.1%(-0.629)#12,859 |
| 2. | 80104 | 3.3% | 4.1%(-0.782)#212 | 4.1%(-0.841)#13,897 |
| 3. | 80108 | 2.0% | 4.1%(-2.09)#323 | 4.1%(-2.15)#20,630 |
1
Common Questions
What are the Top Zip Codes with the Highest Percentage of Population Employed in Administrative & Support Services in Castle Rock, CO?
Top Zip Codes with the Highest Percentage of Population Employed in Administrative & Support Services in Castle Rock, CO are:
What zip code has the Highest Percentage of Population Employed in Administrative & Support Services in Castle Rock, CO?
80109 has the Highest Percentage of Population Employed in Administrative & Support Services in Castle Rock, CO with 3.5%.
What is the Percentage of Population Employed in Administrative & Support Services in Castle Rock, CO?
Percentage of Population Employed in Administrative & Support Services in Castle Rock is 3.4%.
What is the Percentage of Population Employed in Administrative & Support Services in Colorado?
Percentage of Population Employed in Administrative & Support Services in Colorado is 4.1%.
What is the Percentage of Population Employed in Administrative & Support Services in the United States?
Percentage of Population Employed in Administrative & Support Services in the United States is 4.1%.