Zip Codes with the Highest Percentage of Population with a Degree in Visual and Performing Arts in Castle Rock, CO
RELATED REPORTS & OPTIONS
Visual and Performing Arts
Castle Rock
Compare Zip Codes
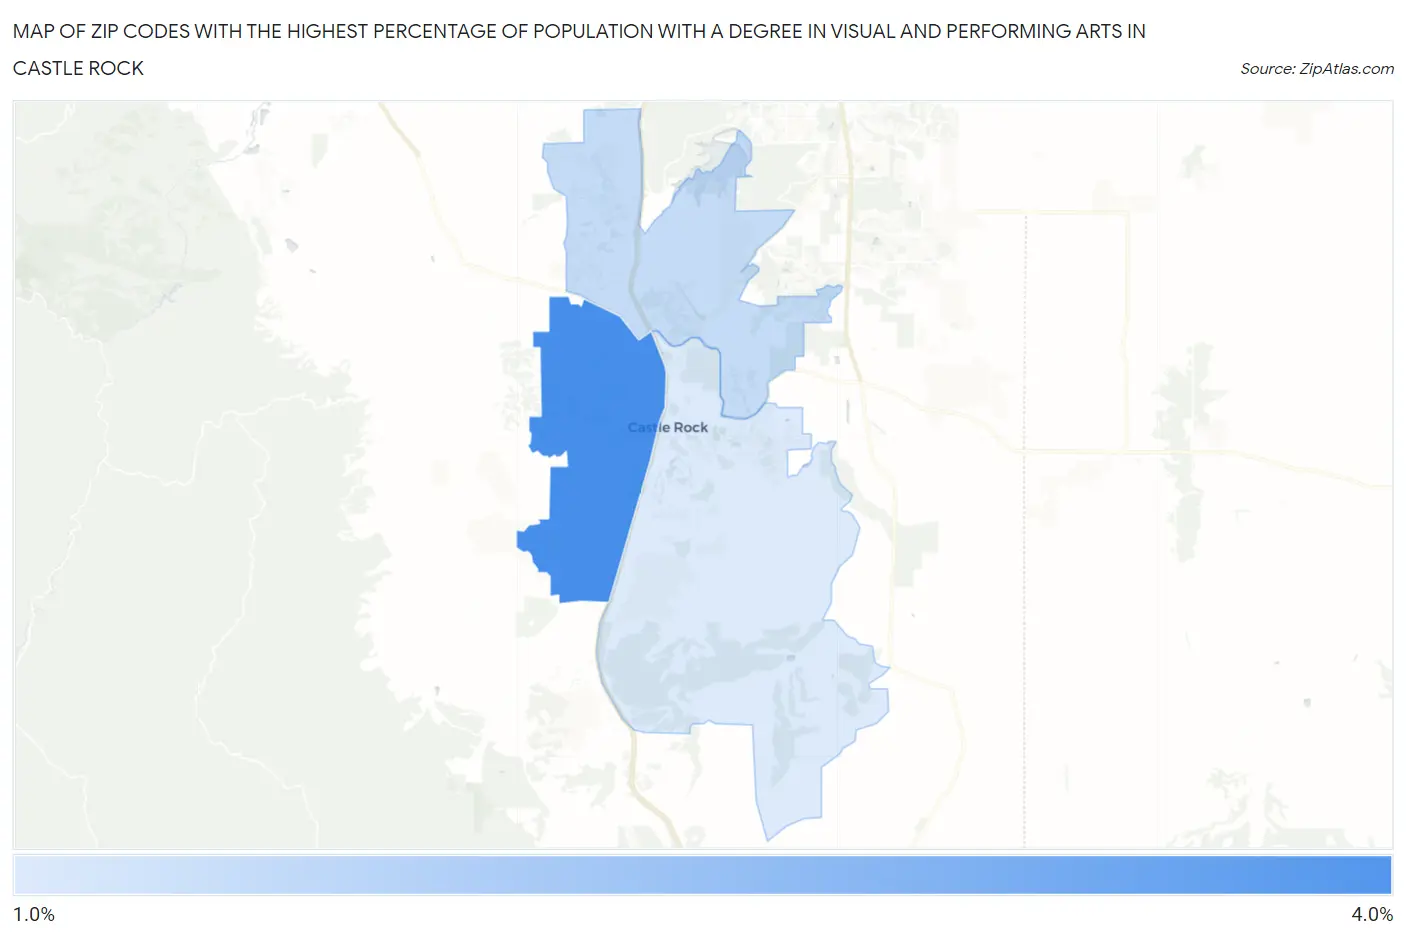
Map of Zip Codes with the Highest Percentage of Population with a Degree in Visual and Performing Arts in Castle Rock
0.0%
4.0%
Zip Codes with the Highest Percentage of Population with a Degree in Visual and Performing Arts in Castle Rock, CO
| Zip Code | % Graduates | vs State | vs National | |
| 1. | 80109 | 3.5% | 4.3%(-0.850)#215 | 4.3%(-0.775)#10,969 |
| 2. | 80108 | 2.2% | 4.3%(-2.13)#290 | 4.3%(-2.05)#15,703 |
| 3. | 80104 | 2.0% | 4.3%(-2.36)#299 | 4.3%(-2.28)#16,550 |
1
Common Questions
What are the Top Zip Codes with the Highest Percentage of Population with a Degree in Visual and Performing Arts in Castle Rock, CO?
Top Zip Codes with the Highest Percentage of Population with a Degree in Visual and Performing Arts in Castle Rock, CO are:
What zip code has the Highest Percentage of Population with a Degree in Visual and Performing Arts in Castle Rock, CO?
80109 has the Highest Percentage of Population with a Degree in Visual and Performing Arts in Castle Rock, CO with 3.5%.
What is the Percentage of Population with a Degree in Visual and Performing Arts in Castle Rock, CO?
Percentage of Population with a Degree in Visual and Performing Arts in Castle Rock is 2.5%.
What is the Percentage of Population with a Degree in Visual and Performing Arts in Colorado?
Percentage of Population with a Degree in Visual and Performing Arts in Colorado is 4.3%.
What is the Percentage of Population with a Degree in Visual and Performing Arts in the United States?
Percentage of Population with a Degree in Visual and Performing Arts in the United States is 4.3%.