Zip Codes with the Highest Percentage of Population Employed in Accommodation & Food Services in Castle Rock, CO
RELATED REPORTS & OPTIONS
Accommodation & Food Services
Castle Rock
Compare Zip Codes
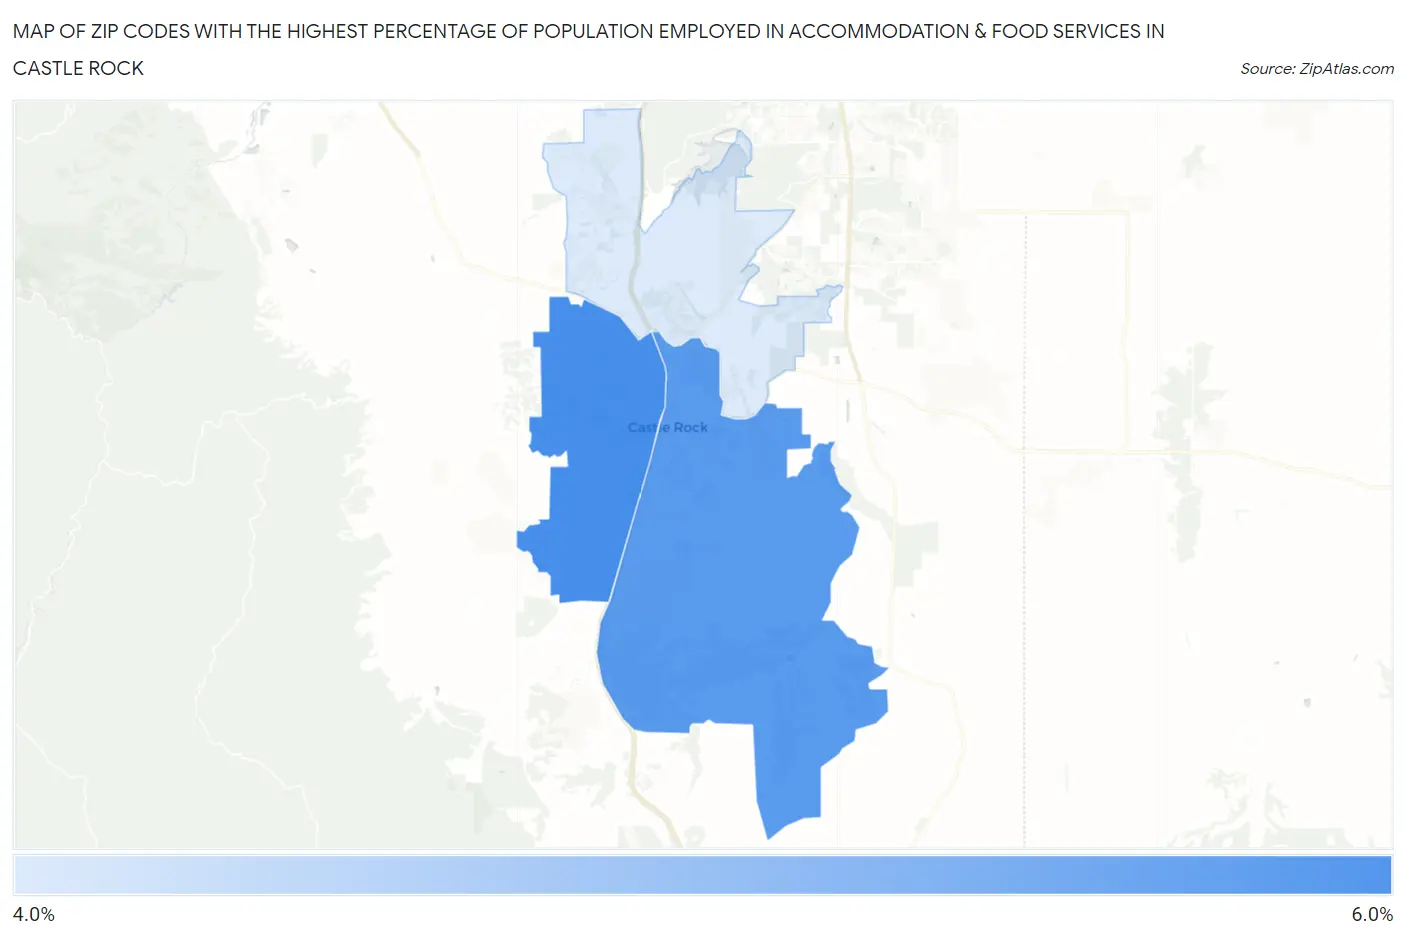
Map of Zip Codes with the Highest Percentage of Population Employed in Accommodation & Food Services in Castle Rock
0.0%
6.0%
Zip Codes with the Highest Percentage of Population Employed in Accommodation & Food Services in Castle Rock, CO
| Zip Code | % Employed | vs State | vs National | |
| 1. | 80109 | 6.0% | 6.9%(-0.906)#223 | 6.9%(-0.886)#13,460 |
| 2. | 80104 | 5.9% | 6.9%(-1.02)#227 | 6.9%(-1.00)#13,858 |
| 3. | 80108 | 4.9% | 6.9%(-2.03)#287 | 6.9%(-2.01)#17,238 |
1
Common Questions
What are the Top Zip Codes with the Highest Percentage of Population Employed in Accommodation & Food Services in Castle Rock, CO?
Top Zip Codes with the Highest Percentage of Population Employed in Accommodation & Food Services in Castle Rock, CO are:
What zip code has the Highest Percentage of Population Employed in Accommodation & Food Services in Castle Rock, CO?
80109 has the Highest Percentage of Population Employed in Accommodation & Food Services in Castle Rock, CO with 6.0%.
What is the Percentage of Population Employed in Accommodation & Food Services in Castle Rock, CO?
Percentage of Population Employed in Accommodation & Food Services in Castle Rock is 5.9%.
What is the Percentage of Population Employed in Accommodation & Food Services in Colorado?
Percentage of Population Employed in Accommodation & Food Services in Colorado is 6.9%.
What is the Percentage of Population Employed in Accommodation & Food Services in the United States?
Percentage of Population Employed in Accommodation & Food Services in the United States is 6.9%.