Zip Codes with the Highest Percentage of Population Taking Taxi / Cab to Work in Castle Rock, CO
RELATED REPORTS & OPTIONS
Taxi / Cab
Castle Rock
Compare Zip Codes
Map of Zip Codes with the Highest Percentage of Population Taking Taxi / Cab to Work in Castle Rock
0.0%
50.0%
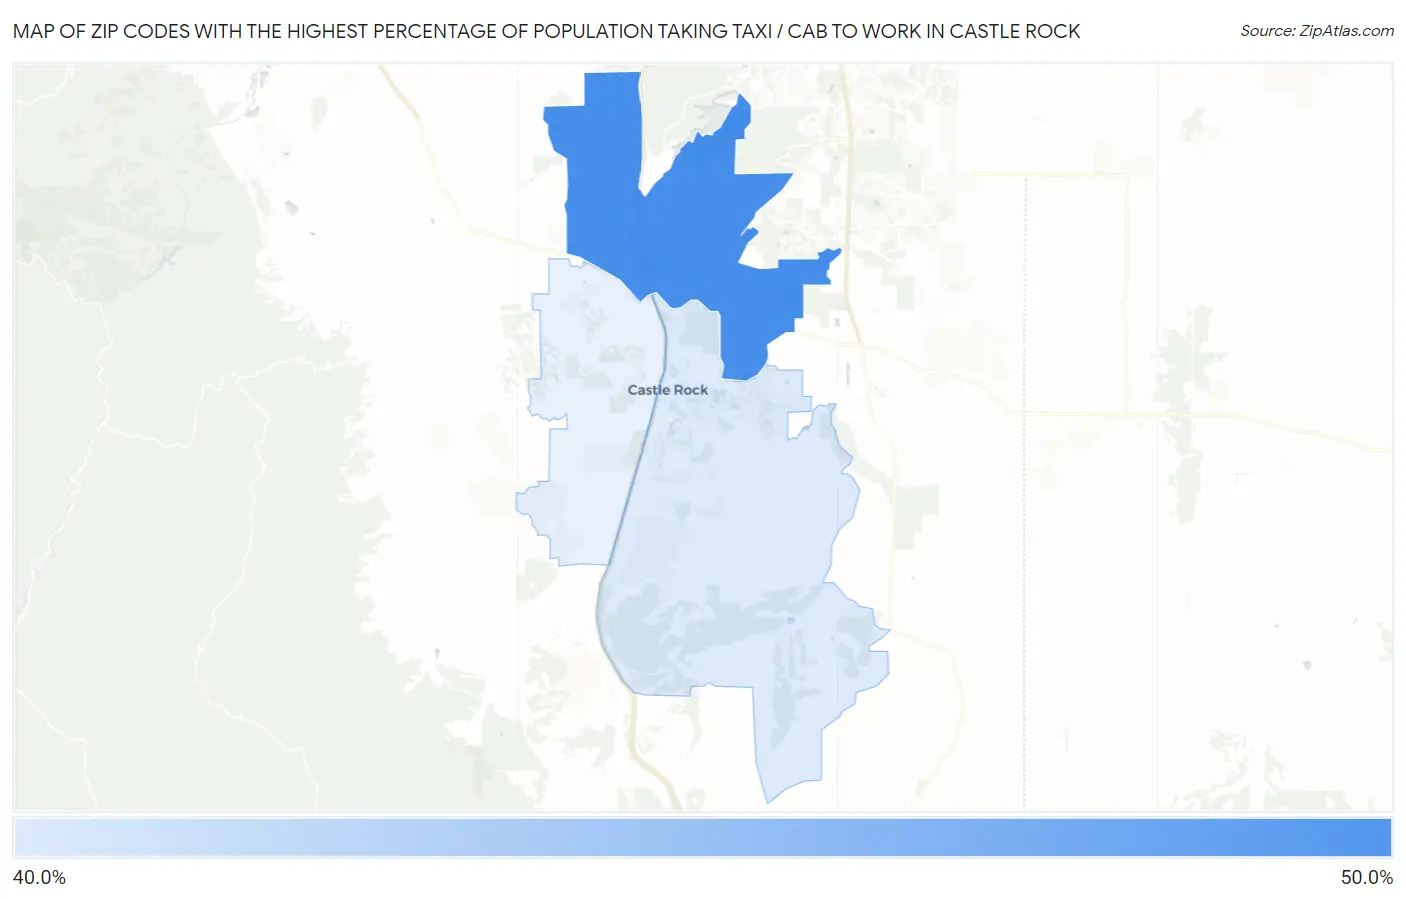
Zip Codes with the Highest Percentage of Population Taking Taxi / Cab to Work in Castle Rock, CO
| Zip Code | % Take Taxi / Cab | vs State | vs National | |
| 1. | 80108 | 45.8% | 37.4%(+8.40)#66 | 38.2%(+7.60)#4,351 |
| 2. | 80104 | 41.9% | 37.4%(+4.50)#89 | 38.2%(+3.70)#5,758 |
1
Common Questions
What are the Top Zip Codes with the Highest Percentage of Population Taking Taxi / Cab to Work in Castle Rock, CO?
Top Zip Codes with the Highest Percentage of Population Taking Taxi / Cab to Work in Castle Rock, CO are:
What zip code has the Highest Percentage of Population Taking Taxi / Cab to Work in Castle Rock, CO?
80108 has the Highest Percentage of Population Taking Taxi / Cab to Work in Castle Rock, CO with 45.8%.
What is the Percentage of Population Taking Taxi / Cab to Work in Castle Rock, CO?
Percentage of Population Taking Taxi / Cab to Work in Castle Rock is 45.3%.
What is the Percentage of Population Taking Taxi / Cab to Work in Colorado?
Percentage of Population Taking Taxi / Cab to Work in Colorado is 37.4%.
What is the Percentage of Population Taking Taxi / Cab to Work in the United States?
Percentage of Population Taking Taxi / Cab to Work in the United States is 38.2%.