Zip Codes with the Highest Percentage of Population Employed in Architecture & Engineering in Arvada, CO
RELATED REPORTS & OPTIONS
Architecture & Engineering
Arvada
Compare Zip Codes
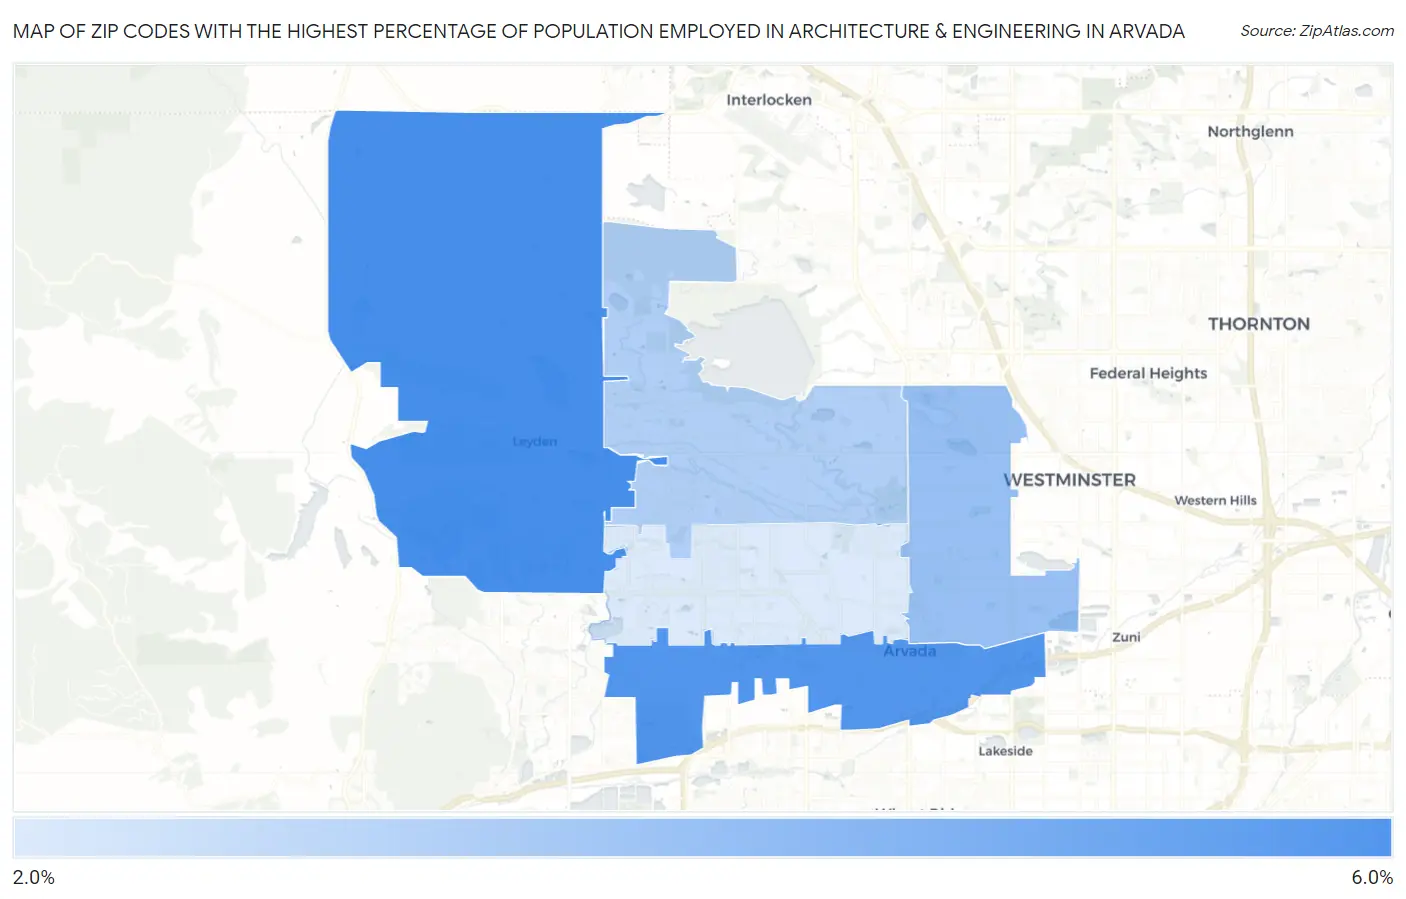
Map of Zip Codes with the Highest Percentage of Population Employed in Architecture & Engineering in Arvada
0.0%
6.0%
Zip Codes with the Highest Percentage of Population Employed in Architecture & Engineering in Arvada, CO
| Zip Code | % Employed | vs State | vs National | |
| 1. | 80007 | 5.0% | 2.9%(+2.12)#36 | 2.1%(+2.89)#1,635 |
| 2. | 80002 | 4.9% | 2.9%(+1.96)#38 | 2.1%(+2.73)#1,760 |
| 3. | 80003 | 3.9% | 2.9%(+1.02)#76 | 2.1%(+1.79)#2,870 |
| 4. | 80005 | 3.6% | 2.9%(+0.658)#93 | 2.1%(+1.43)#3,547 |
| 5. | 80004 | 3.0% | 2.9%(+0.054)#122 | 2.1%(+0.827)#5,137 |
1
Common Questions
What are the Top 3 Zip Codes with the Highest Percentage of Population Employed in Architecture & Engineering in Arvada, CO?
Top 3 Zip Codes with the Highest Percentage of Population Employed in Architecture & Engineering in Arvada, CO are:
What zip code has the Highest Percentage of Population Employed in Architecture & Engineering in Arvada, CO?
80007 has the Highest Percentage of Population Employed in Architecture & Engineering in Arvada, CO with 5.0%.
What is the Percentage of Population Employed in Architecture & Engineering in Arvada, CO?
Percentage of Population Employed in Architecture & Engineering in Arvada is 4.0%.
What is the Percentage of Population Employed in Architecture & Engineering in Colorado?
Percentage of Population Employed in Architecture & Engineering in Colorado is 2.9%.
What is the Percentage of Population Employed in Architecture & Engineering in the United States?
Percentage of Population Employed in Architecture & Engineering in the United States is 2.1%.