Zip Codes with the Highest Percentage of Population Employed in Architecture & Engineering in Fort Collins, CO
RELATED REPORTS & OPTIONS
Architecture & Engineering
Fort Collins
Compare Zip Codes
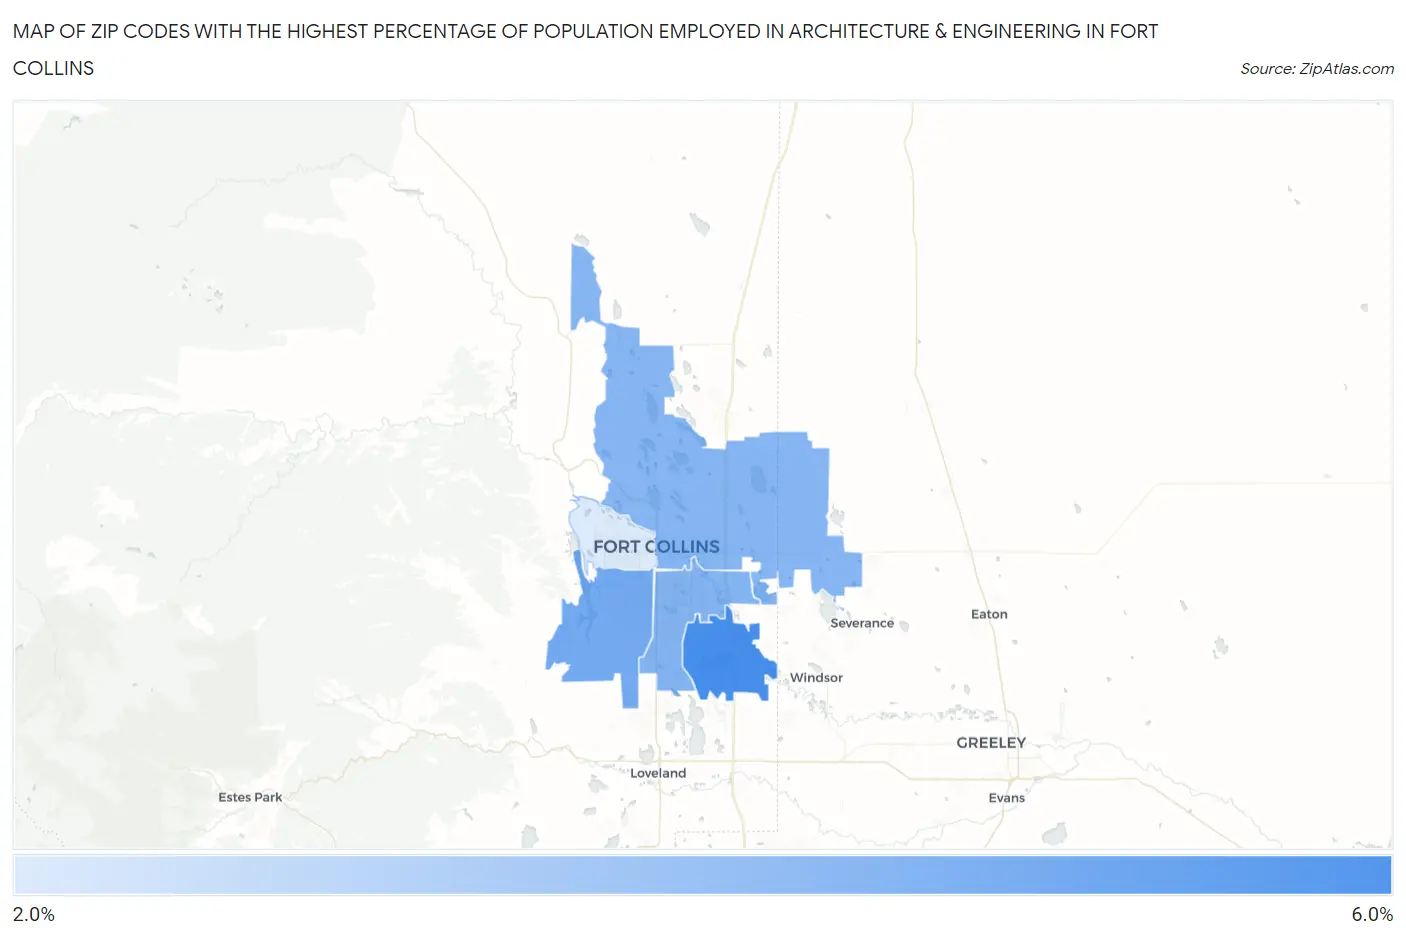
Map of Zip Codes with the Highest Percentage of Population Employed in Architecture & Engineering in Fort Collins
0.0%
6.0%
Zip Codes with the Highest Percentage of Population Employed in Architecture & Engineering in Fort Collins, CO
| Zip Code | % Employed | vs State | vs National | |
| 1. | 80528 | 5.2% | 2.9%(+2.33)#32 | 2.1%(+3.10)#1,488 |
| 2. | 80526 | 4.3% | 2.9%(+1.39)#61 | 2.1%(+2.16)#2,358 |
| 3. | 80525 | 4.0% | 2.9%(+1.06)#72 | 2.1%(+1.83)#2,806 |
| 4. | 80524 | 3.9% | 2.9%(+1.01)#77 | 2.1%(+1.78)#2,882 |
| 5. | 80521 | 2.1% | 2.9%(-0.869)#194 | 2.1%(-0.097)#9,312 |
1
Common Questions
What are the Top 3 Zip Codes with the Highest Percentage of Population Employed in Architecture & Engineering in Fort Collins, CO?
Top 3 Zip Codes with the Highest Percentage of Population Employed in Architecture & Engineering in Fort Collins, CO are:
What zip code has the Highest Percentage of Population Employed in Architecture & Engineering in Fort Collins, CO?
80528 has the Highest Percentage of Population Employed in Architecture & Engineering in Fort Collins, CO with 5.2%.
What is the Percentage of Population Employed in Architecture & Engineering in Fort Collins, CO?
Percentage of Population Employed in Architecture & Engineering in Fort Collins is 3.9%.
What is the Percentage of Population Employed in Architecture & Engineering in Colorado?
Percentage of Population Employed in Architecture & Engineering in Colorado is 2.9%.
What is the Percentage of Population Employed in Architecture & Engineering in the United States?
Percentage of Population Employed in Architecture & Engineering in the United States is 2.1%.