Zip Codes with the Highest Percentage of Population Employed in Administrative & Support Services in Durango, CO
RELATED REPORTS & OPTIONS
Administrative & Support Services
Durango
Compare Zip Codes
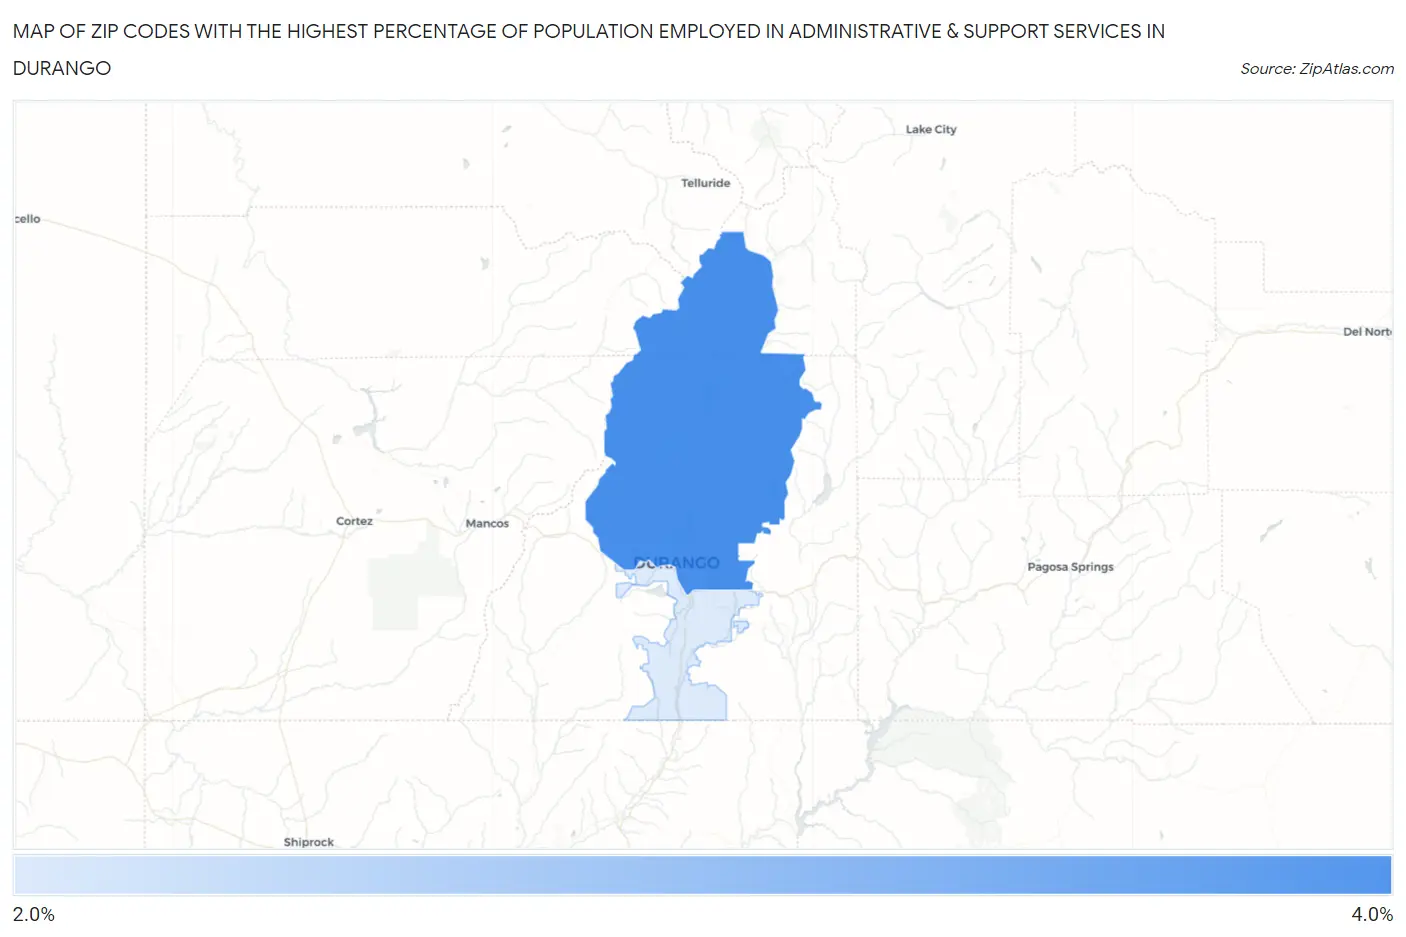
Map of Zip Codes with the Highest Percentage of Population Employed in Administrative & Support Services in Durango
0.0%
4.0%
Zip Codes with the Highest Percentage of Population Employed in Administrative & Support Services in Durango, CO
| Zip Code | % Employed | vs State | vs National | |
| 1. | 81301 | 3.7% | 4.1%(-0.363)#183 | 4.1%(-0.422)#11,873 |
| 2. | 81303 | 2.4% | 4.1%(-1.74)#299 | 4.1%(-1.79)#18,898 |
1
Common Questions
What are the Top Zip Codes with the Highest Percentage of Population Employed in Administrative & Support Services in Durango, CO?
Top Zip Codes with the Highest Percentage of Population Employed in Administrative & Support Services in Durango, CO are:
What zip code has the Highest Percentage of Population Employed in Administrative & Support Services in Durango, CO?
81301 has the Highest Percentage of Population Employed in Administrative & Support Services in Durango, CO with 3.7%.
What is the Percentage of Population Employed in Administrative & Support Services in Durango, CO?
Percentage of Population Employed in Administrative & Support Services in Durango is 3.8%.
What is the Percentage of Population Employed in Administrative & Support Services in Colorado?
Percentage of Population Employed in Administrative & Support Services in Colorado is 4.1%.
What is the Percentage of Population Employed in Administrative & Support Services in the United States?
Percentage of Population Employed in Administrative & Support Services in the United States is 4.1%.