Zip Codes with the Highest Percentage of Population Employed in Administrative & Support Services in Loveland, CO
RELATED REPORTS & OPTIONS
Administrative & Support Services
Loveland
Compare Zip Codes
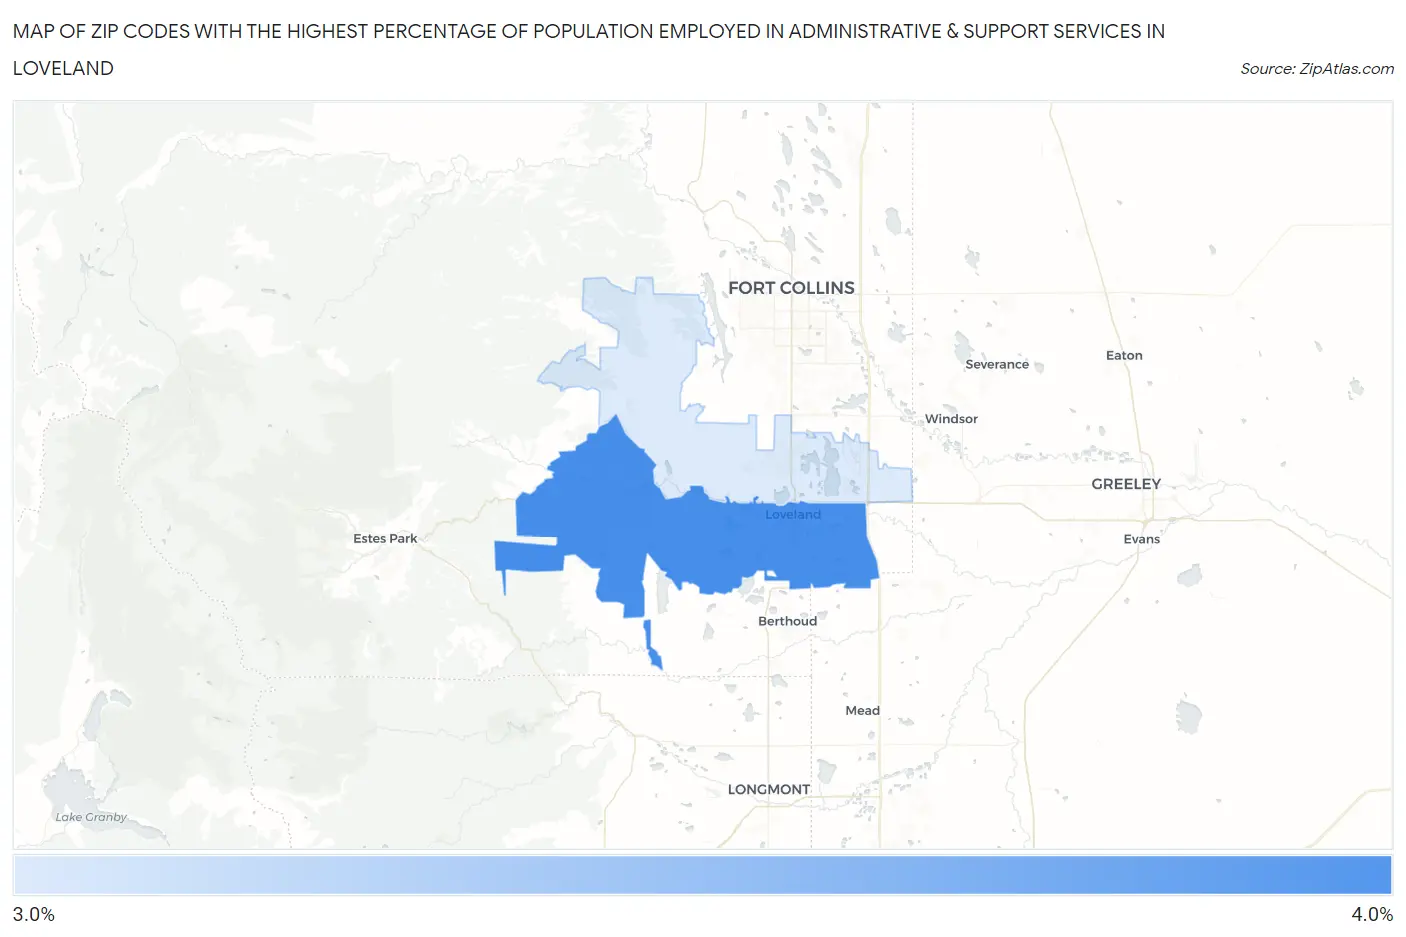
Map of Zip Codes with the Highest Percentage of Population Employed in Administrative & Support Services in Loveland
0.0%
4.0%
Zip Codes with the Highest Percentage of Population Employed in Administrative & Support Services in Loveland, CO
| Zip Code | % Employed | vs State | vs National | |
| 1. | 80537 | 3.9% | 4.1%(-0.238)#175 | 4.1%(-0.297)#11,313 |
| 2. | 80538 | 3.5% | 4.1%(-0.639)#205 | 4.1%(-0.697)#13,202 |
1
Common Questions
What are the Top Zip Codes with the Highest Percentage of Population Employed in Administrative & Support Services in Loveland, CO?
Top Zip Codes with the Highest Percentage of Population Employed in Administrative & Support Services in Loveland, CO are:
What zip code has the Highest Percentage of Population Employed in Administrative & Support Services in Loveland, CO?
80537 has the Highest Percentage of Population Employed in Administrative & Support Services in Loveland, CO with 3.9%.
What is the Percentage of Population Employed in Administrative & Support Services in Loveland, CO?
Percentage of Population Employed in Administrative & Support Services in Loveland is 3.8%.
What is the Percentage of Population Employed in Administrative & Support Services in Colorado?
Percentage of Population Employed in Administrative & Support Services in Colorado is 4.1%.
What is the Percentage of Population Employed in Administrative & Support Services in the United States?
Percentage of Population Employed in Administrative & Support Services in the United States is 4.1%.