Zip Codes with the Highest Percentage of Population Employed in Accommodation & Food Services in Golden, CO
RELATED REPORTS & OPTIONS
Accommodation & Food Services
Golden
Compare Zip Codes
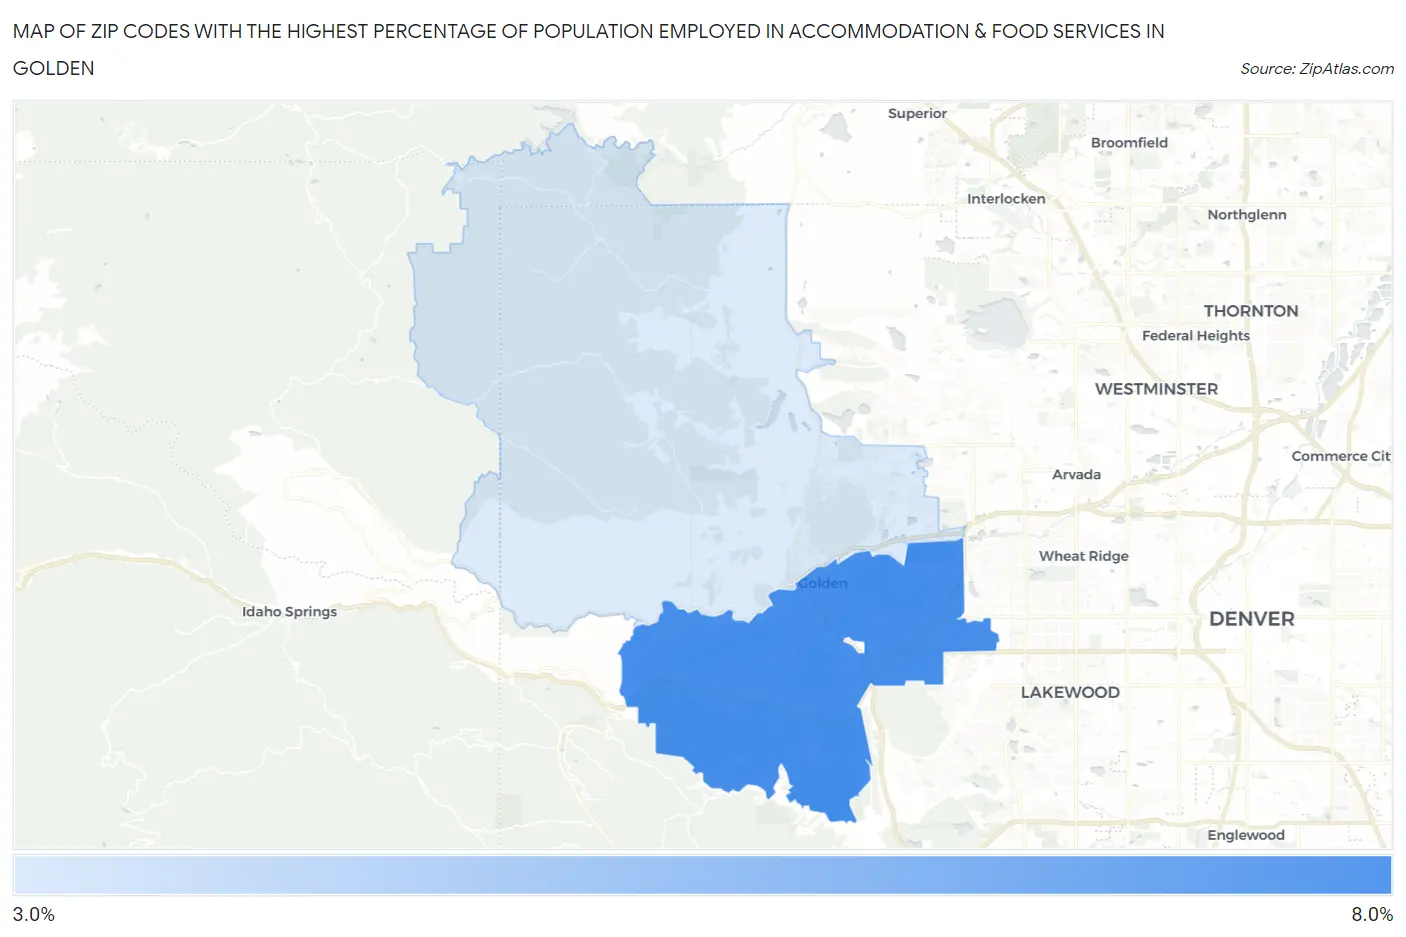
Map of Zip Codes with the Highest Percentage of Population Employed in Accommodation & Food Services in Golden
0.0%
8.0%
Zip Codes with the Highest Percentage of Population Employed in Accommodation & Food Services in Golden, CO
| Zip Code | % Employed | vs State | vs National | |
| 1. | 80401 | 6.1% | 6.9%(-0.788)#215 | 6.9%(-0.767)#13,085 |
| 2. | 80403 | 3.4% | 6.9%(-3.45)#346 | 6.9%(-3.43)#21,935 |
1
Common Questions
What are the Top Zip Codes with the Highest Percentage of Population Employed in Accommodation & Food Services in Golden, CO?
Top Zip Codes with the Highest Percentage of Population Employed in Accommodation & Food Services in Golden, CO are:
What zip code has the Highest Percentage of Population Employed in Accommodation & Food Services in Golden, CO?
80401 has the Highest Percentage of Population Employed in Accommodation & Food Services in Golden, CO with 6.1%.
What is the Percentage of Population Employed in Accommodation & Food Services in Golden, CO?
Percentage of Population Employed in Accommodation & Food Services in Golden is 7.4%.
What is the Percentage of Population Employed in Accommodation & Food Services in Colorado?
Percentage of Population Employed in Accommodation & Food Services in Colorado is 6.9%.
What is the Percentage of Population Employed in Accommodation & Food Services in the United States?
Percentage of Population Employed in Accommodation & Food Services in the United States is 6.9%.