Zip Codes with the Highest Percentage of Population Employed in Accommodation & Food Services in Arvada, CO
RELATED REPORTS & OPTIONS
Accommodation & Food Services
Arvada
Compare Zip Codes
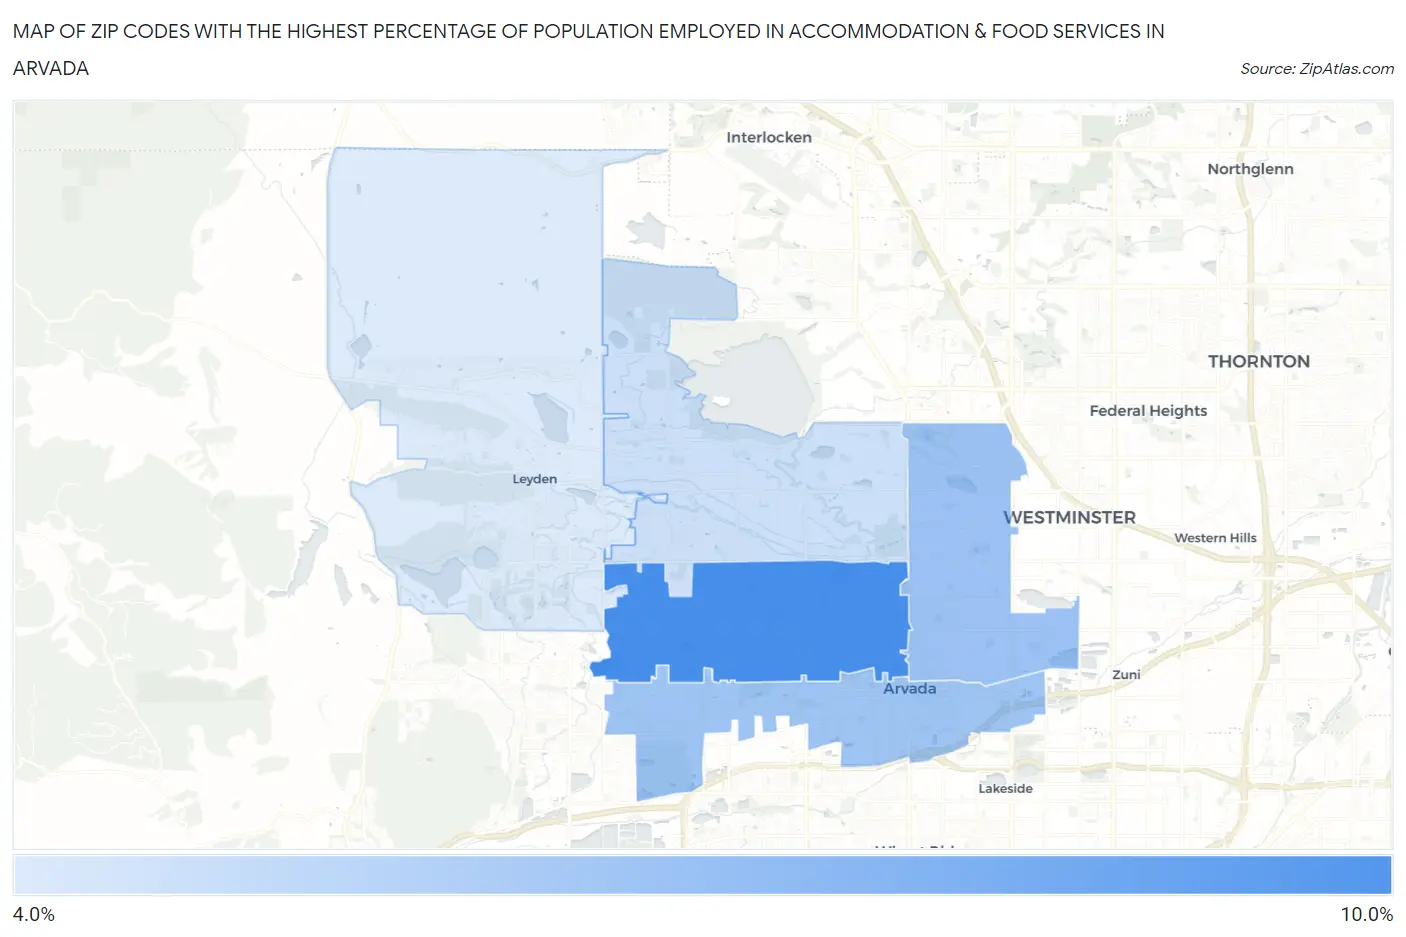
Map of Zip Codes with the Highest Percentage of Population Employed in Accommodation & Food Services in Arvada
0.0%
10.0%
Zip Codes with the Highest Percentage of Population Employed in Accommodation & Food Services in Arvada, CO
| Zip Code | % Employed | vs State | vs National | |
| 1. | 80004 | 9.2% | 6.9%(+2.25)#108 | 6.9%(+2.27)#5,730 |
| 2. | 80003 | 6.5% | 6.9%(-0.399)#197 | 6.9%(-0.379)#11,845 |
| 3. | 80002 | 6.5% | 6.9%(-0.447)#199 | 6.9%(-0.427)#11,985 |
| 4. | 80005 | 5.1% | 6.9%(-1.84)#275 | 6.9%(-1.82)#16,609 |
| 5. | 80007 | 4.6% | 6.9%(-2.33)#306 | 6.9%(-2.31)#18,264 |
1
Common Questions
What are the Top 3 Zip Codes with the Highest Percentage of Population Employed in Accommodation & Food Services in Arvada, CO?
Top 3 Zip Codes with the Highest Percentage of Population Employed in Accommodation & Food Services in Arvada, CO are:
What zip code has the Highest Percentage of Population Employed in Accommodation & Food Services in Arvada, CO?
80004 has the Highest Percentage of Population Employed in Accommodation & Food Services in Arvada, CO with 9.2%.
What is the Percentage of Population Employed in Accommodation & Food Services in Arvada, CO?
Percentage of Population Employed in Accommodation & Food Services in Arvada is 6.5%.
What is the Percentage of Population Employed in Accommodation & Food Services in Colorado?
Percentage of Population Employed in Accommodation & Food Services in Colorado is 6.9%.
What is the Percentage of Population Employed in Accommodation & Food Services in the United States?
Percentage of Population Employed in Accommodation & Food Services in the United States is 6.9%.