Zip Codes with the Highest Percentage of Population Employed in Accommodation & Food Services in Montrose, CO
RELATED REPORTS & OPTIONS
Accommodation & Food Services
Montrose
Compare Zip Codes
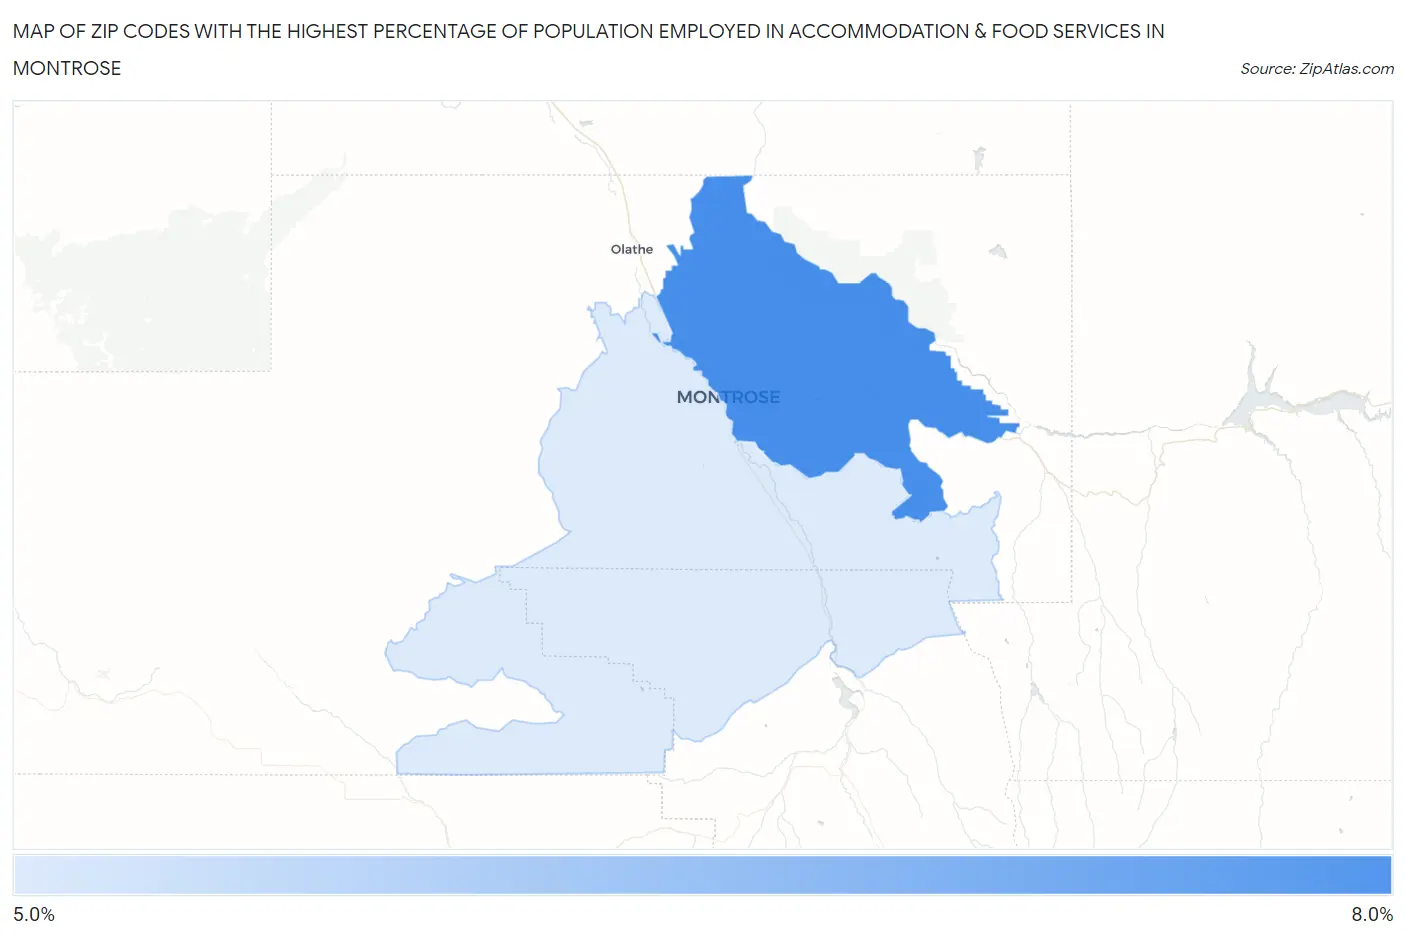
Map of Zip Codes with the Highest Percentage of Population Employed in Accommodation & Food Services in Montrose
0.0%
8.0%
Zip Codes with the Highest Percentage of Population Employed in Accommodation & Food Services in Montrose, CO
| Zip Code | % Employed | vs State | vs National | |
| 1. | 81401 | 6.7% | 6.9%(-0.234)#192 | 6.9%(-0.214)#11,290 |
| 2. | 81403 | 5.6% | 6.9%(-1.30)#240 | 6.9%(-1.28)#14,696 |
1
Common Questions
What are the Top Zip Codes with the Highest Percentage of Population Employed in Accommodation & Food Services in Montrose, CO?
Top Zip Codes with the Highest Percentage of Population Employed in Accommodation & Food Services in Montrose, CO are:
What zip code has the Highest Percentage of Population Employed in Accommodation & Food Services in Montrose, CO?
81401 has the Highest Percentage of Population Employed in Accommodation & Food Services in Montrose, CO with 6.7%.
What is the Percentage of Population Employed in Accommodation & Food Services in Montrose, CO?
Percentage of Population Employed in Accommodation & Food Services in Montrose is 6.4%.
What is the Percentage of Population Employed in Accommodation & Food Services in Colorado?
Percentage of Population Employed in Accommodation & Food Services in Colorado is 6.9%.
What is the Percentage of Population Employed in Accommodation & Food Services in the United States?
Percentage of Population Employed in Accommodation & Food Services in the United States is 6.9%.