Zip Codes with the Highest Percentage of Population Employed in Accommodation & Food Services in Longmont, CO
RELATED REPORTS & OPTIONS
Accommodation & Food Services
Longmont
Compare Zip Codes
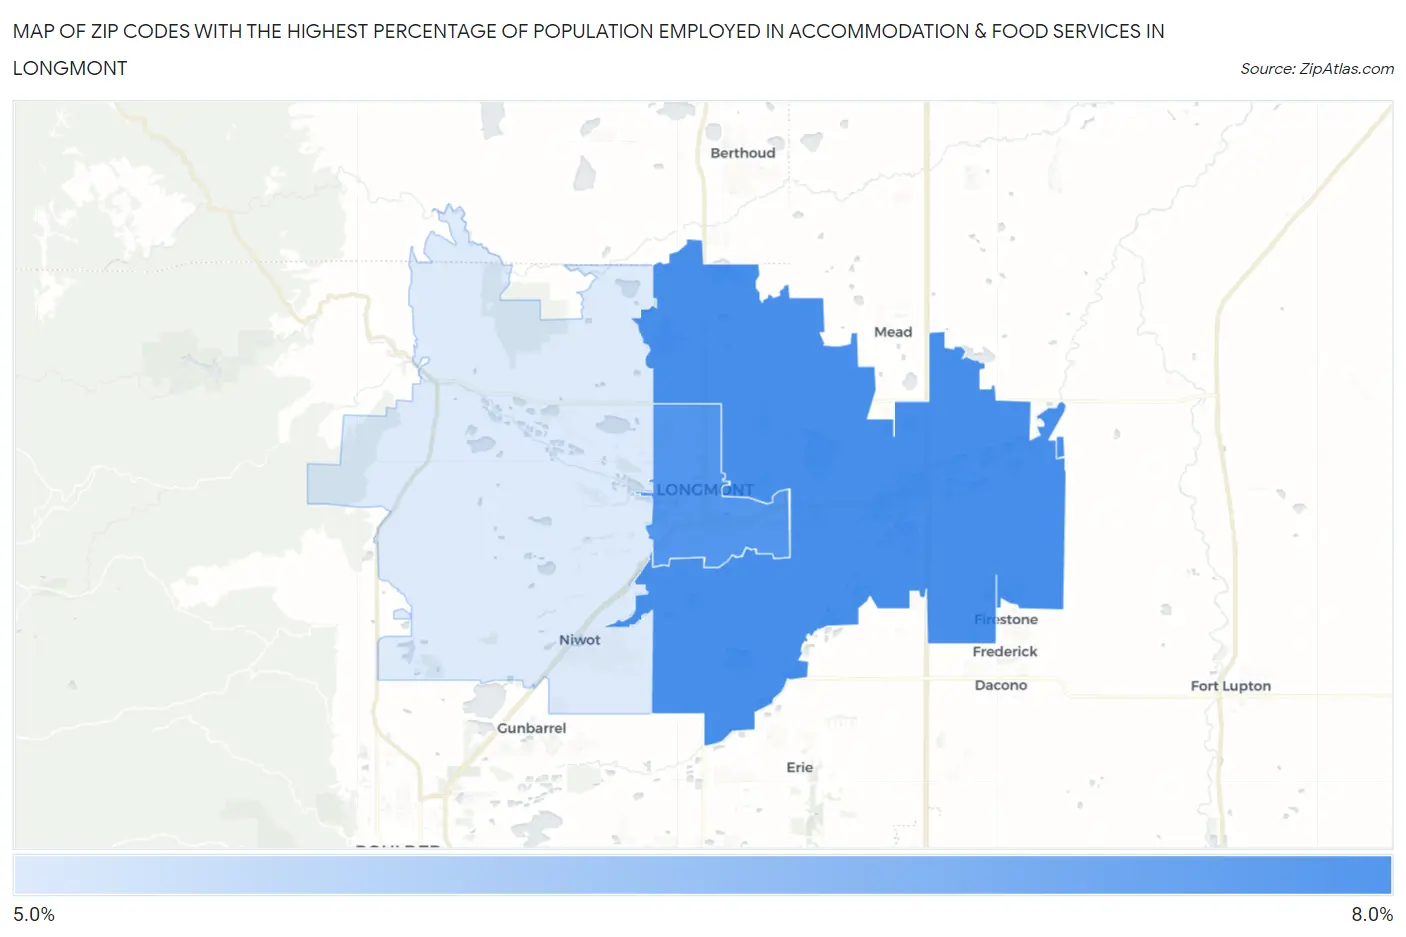
Map of Zip Codes with the Highest Percentage of Population Employed in Accommodation & Food Services in Longmont
0.0%
8.0%
Zip Codes with the Highest Percentage of Population Employed in Accommodation & Food Services in Longmont, CO
| Zip Code | % Employed | vs State | vs National | |
| 1. | 80504 | 6.3% | 6.9%(-0.605)#208 | 6.9%(-0.585)#12,492 |
| 2. | 80501 | 6.2% | 6.9%(-0.695)#211 | 6.9%(-0.675)#12,774 |
| 3. | 80503 | 5.2% | 6.9%(-1.71)#267 | 6.9%(-1.69)#16,144 |
1
Common Questions
What are the Top Zip Codes with the Highest Percentage of Population Employed in Accommodation & Food Services in Longmont, CO?
Top Zip Codes with the Highest Percentage of Population Employed in Accommodation & Food Services in Longmont, CO are:
What zip code has the Highest Percentage of Population Employed in Accommodation & Food Services in Longmont, CO?
80504 has the Highest Percentage of Population Employed in Accommodation & Food Services in Longmont, CO with 6.3%.
What is the Percentage of Population Employed in Accommodation & Food Services in Longmont, CO?
Percentage of Population Employed in Accommodation & Food Services in Longmont is 5.9%.
What is the Percentage of Population Employed in Accommodation & Food Services in Colorado?
Percentage of Population Employed in Accommodation & Food Services in Colorado is 6.9%.
What is the Percentage of Population Employed in Accommodation & Food Services in the United States?
Percentage of Population Employed in Accommodation & Food Services in the United States is 6.9%.