Zip Codes with the Highest Percentage of Population Employed in Security & Protection in San Bernardino, CA
RELATED REPORTS & OPTIONS
Security & Protection
San Bernardino
Compare Zip Codes
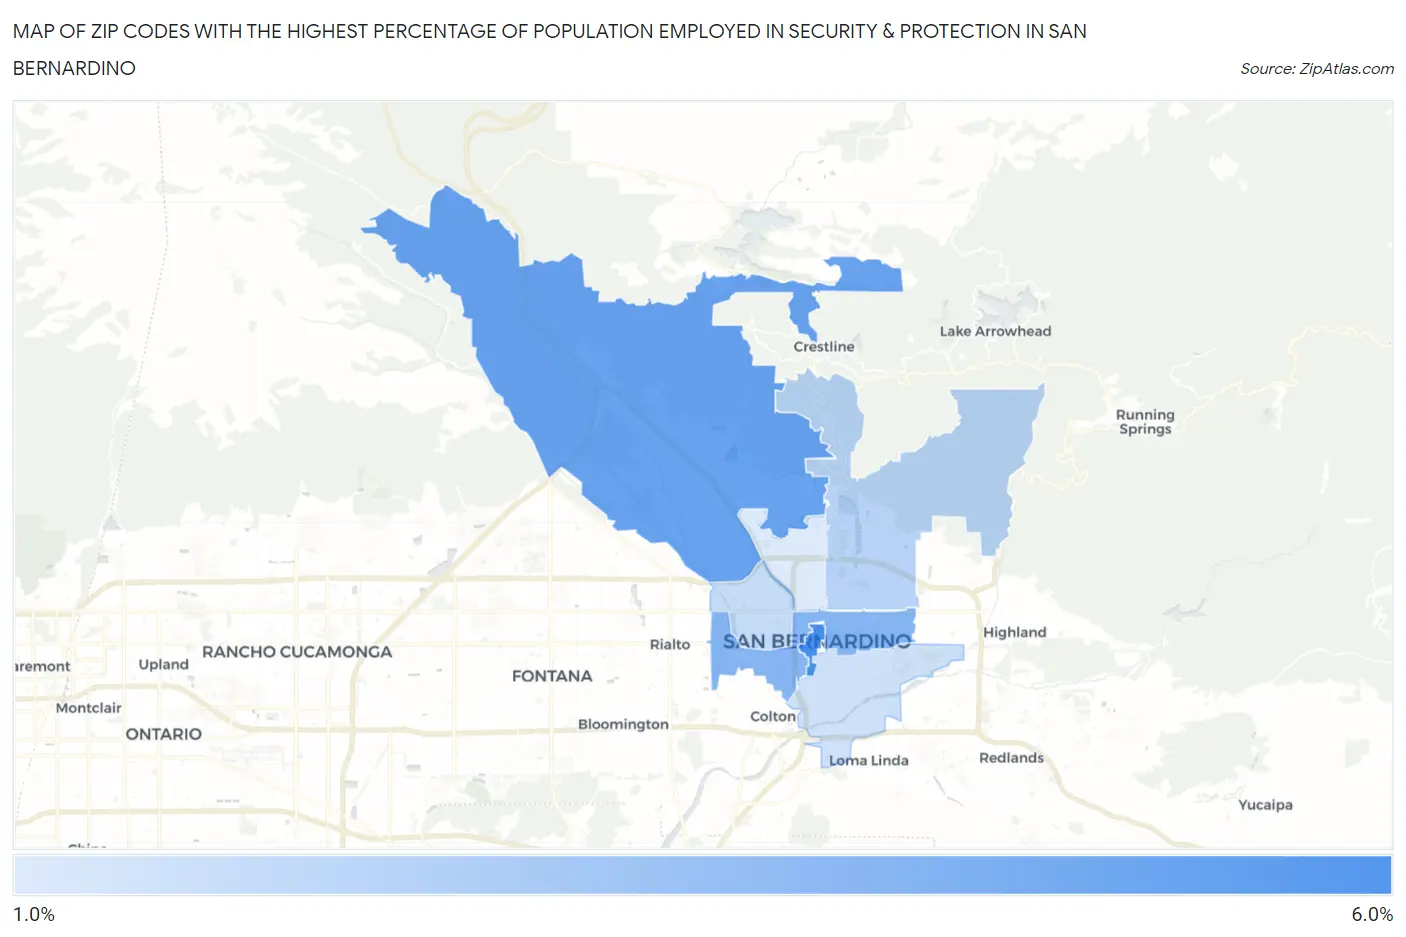
Map of Zip Codes with the Highest Percentage of Population Employed in Security & Protection in San Bernardino
0.0%
6.0%
Zip Codes with the Highest Percentage of Population Employed in Security & Protection in San Bernardino, CA
| Zip Code | % Employed | vs State | vs National | |
| 1. | 92401 | 5.2% | 2.1%(+3.09)#136 | 2.1%(+3.02)#2,742 |
| 2. | 92407 | 4.4% | 2.1%(+2.34)#173 | 2.1%(+2.28)#3,735 |
| 3. | 92410 | 3.7% | 2.1%(+1.61)#252 | 2.1%(+1.54)#5,182 |
| 4. | 92404 | 2.5% | 2.1%(+0.419)#519 | 2.1%(+0.351)#9,513 |
| 5. | 92411 | 2.2% | 2.1%(+0.129)#618 | 2.1%(+0.061)#11,201 |
| 6. | 92408 | 2.0% | 2.1%(-0.071)#712 | 2.1%(-0.139)#12,493 |
| 7. | 92405 | 1.7% | 2.1%(-0.406)#861 | 2.1%(-0.474)#14,871 |
1
Common Questions
What are the Top 5 Zip Codes with the Highest Percentage of Population Employed in Security & Protection in San Bernardino, CA?
Top 5 Zip Codes with the Highest Percentage of Population Employed in Security & Protection in San Bernardino, CA are:
What zip code has the Highest Percentage of Population Employed in Security & Protection in San Bernardino, CA?
92401 has the Highest Percentage of Population Employed in Security & Protection in San Bernardino, CA with 5.2%.
What is the Percentage of Population Employed in Security & Protection in San Bernardino, CA?
Percentage of Population Employed in Security & Protection in San Bernardino is 2.9%.
What is the Percentage of Population Employed in Security & Protection in California?
Percentage of Population Employed in Security & Protection in California is 2.1%.
What is the Percentage of Population Employed in Security & Protection in the United States?
Percentage of Population Employed in Security & Protection in the United States is 2.1%.