Zip Codes with the Highest Percentage of Population Employed in Accommodation & Food Services in Woodland, CA
RELATED REPORTS & OPTIONS
Accommodation & Food Services
Woodland
Compare Zip Codes
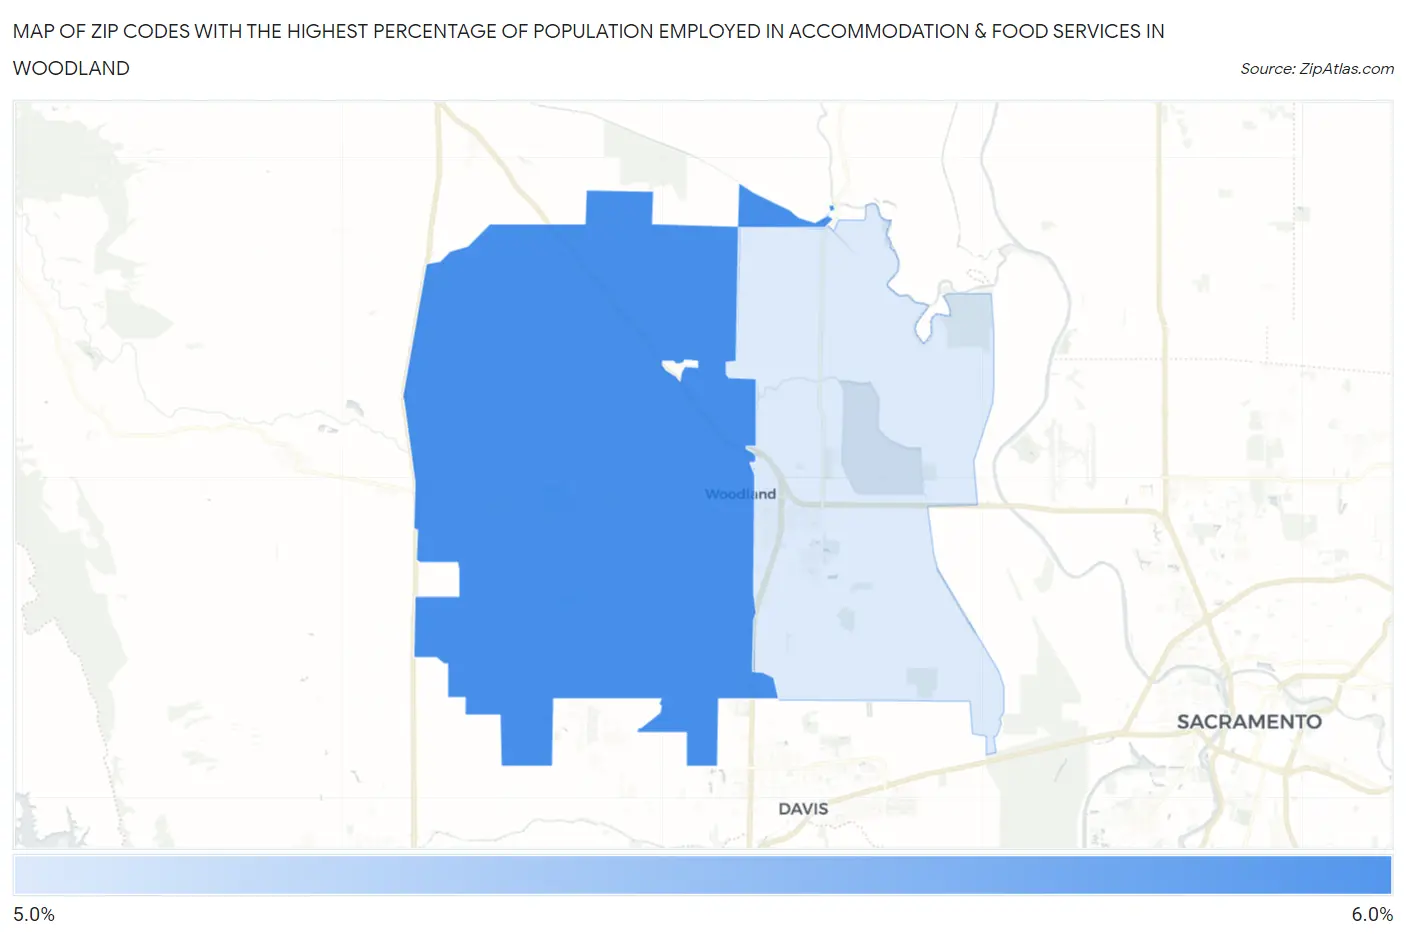
Map of Zip Codes with the Highest Percentage of Population Employed in Accommodation & Food Services in Woodland
0.0%
6.0%
Zip Codes with the Highest Percentage of Population Employed in Accommodation & Food Services in Woodland, CA
| Zip Code | % Employed | vs State | vs National | |
| 1. | 95695 | 5.5% | 7.2%(-1.64)#1,015 | 6.9%(-1.35)#14,940 |
| 2. | 95776 | 5.4% | 7.2%(-1.77)#1,043 | 6.9%(-1.48)#15,421 |
1
Common Questions
What are the Top Zip Codes with the Highest Percentage of Population Employed in Accommodation & Food Services in Woodland, CA?
Top Zip Codes with the Highest Percentage of Population Employed in Accommodation & Food Services in Woodland, CA are:
What zip code has the Highest Percentage of Population Employed in Accommodation & Food Services in Woodland, CA?
95695 has the Highest Percentage of Population Employed in Accommodation & Food Services in Woodland, CA with 5.5%.
What is the Percentage of Population Employed in Accommodation & Food Services in Woodland, CA?
Percentage of Population Employed in Accommodation & Food Services in Woodland is 5.7%.
What is the Percentage of Population Employed in Accommodation & Food Services in California?
Percentage of Population Employed in Accommodation & Food Services in California is 7.2%.
What is the Percentage of Population Employed in Accommodation & Food Services in the United States?
Percentage of Population Employed in Accommodation & Food Services in the United States is 6.9%.