Zip Codes with the Highest Percentage of Population Employed in Accommodation & Food Services in San Luis Obispo, CA
RELATED REPORTS & OPTIONS
Accommodation & Food Services
San Luis Obispo
Compare Zip Codes
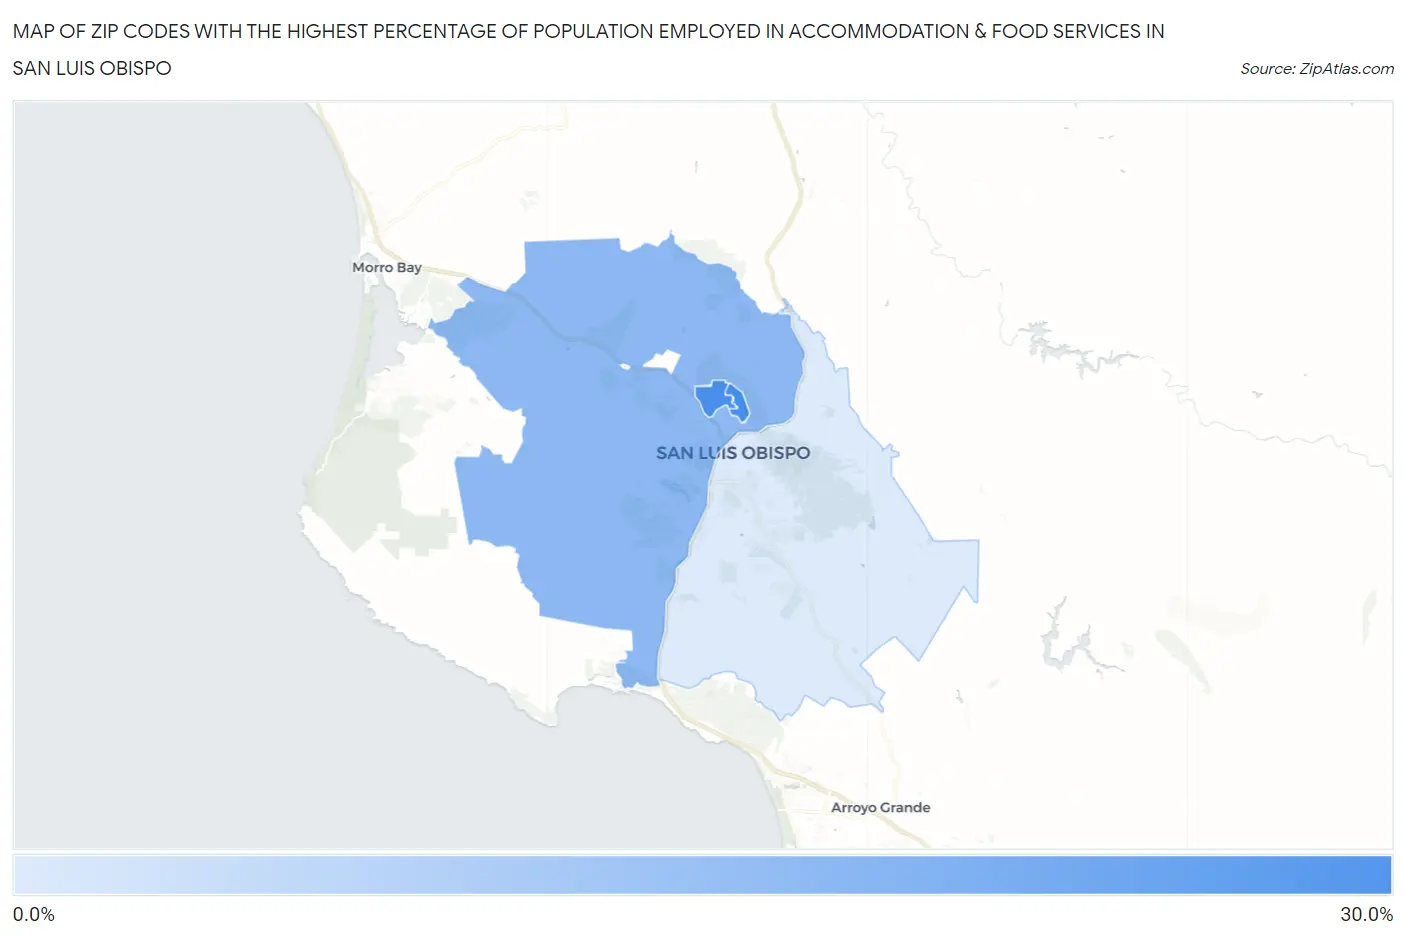
Map of Zip Codes with the Highest Percentage of Population Employed in Accommodation & Food Services in San Luis Obispo
0.0%
30.0%
Zip Codes with the Highest Percentage of Population Employed in Accommodation & Food Services in San Luis Obispo, CA
| Zip Code | % Employed | vs State | vs National | |
| 1. | 93410 | 27.1% | 7.2%(+19.9)#41 | 6.9%(+20.2)#421 |
| 2. | 93407 | 26.8% | 7.2%(+19.7)#42 | 6.9%(+19.9)#427 |
| 3. | 93405 | 18.8% | 7.2%(+11.6)#72 | 6.9%(+11.9)#968 |
| 4. | 93401 | 9.6% | 7.2%(+2.41)#334 | 6.9%(+2.70)#5,096 |
1
Common Questions
What are the Top 3 Zip Codes with the Highest Percentage of Population Employed in Accommodation & Food Services in San Luis Obispo, CA?
Top 3 Zip Codes with the Highest Percentage of Population Employed in Accommodation & Food Services in San Luis Obispo, CA are:
What zip code has the Highest Percentage of Population Employed in Accommodation & Food Services in San Luis Obispo, CA?
93410 has the Highest Percentage of Population Employed in Accommodation & Food Services in San Luis Obispo, CA with 27.1%.
What is the Percentage of Population Employed in Accommodation & Food Services in San Luis Obispo, CA?
Percentage of Population Employed in Accommodation & Food Services in San Luis Obispo is 14.1%.
What is the Percentage of Population Employed in Accommodation & Food Services in California?
Percentage of Population Employed in Accommodation & Food Services in California is 7.2%.
What is the Percentage of Population Employed in Accommodation & Food Services in the United States?
Percentage of Population Employed in Accommodation & Food Services in the United States is 6.9%.