Zip Codes with the Highest Percentage of Population Employed in Accommodation & Food Services in Beverly Hills, CA
RELATED REPORTS & OPTIONS
Accommodation & Food Services
Beverly Hills
Compare Zip Codes
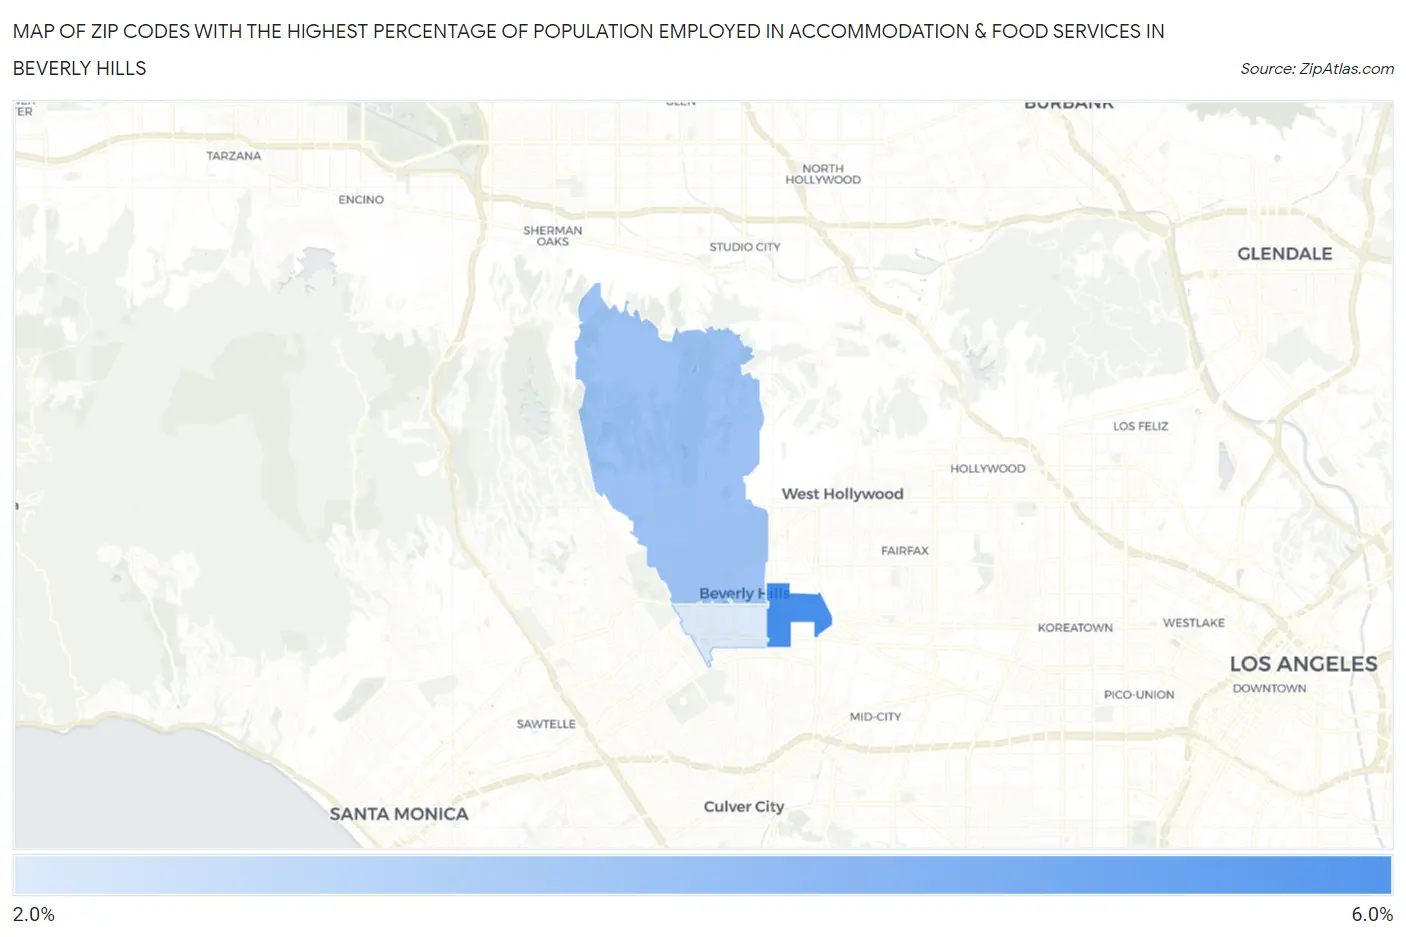
Map of Zip Codes with the Highest Percentage of Population Employed in Accommodation & Food Services in Beverly Hills
0.0%
6.0%
Zip Codes with the Highest Percentage of Population Employed in Accommodation & Food Services in Beverly Hills, CA
| Zip Code | % Employed | vs State | vs National | |
| 1. | 90211 | 5.3% | 7.2%(-1.91)#1,074 | 6.9%(-1.62)#15,921 |
| 2. | 90210 | 3.8% | 7.2%(-3.36)#1,313 | 6.9%(-3.07)#20,775 |
| 3. | 90212 | 2.7% | 7.2%(-4.49)#1,440 | 6.9%(-4.20)#24,043 |
1
Common Questions
What are the Top Zip Codes with the Highest Percentage of Population Employed in Accommodation & Food Services in Beverly Hills, CA?
Top Zip Codes with the Highest Percentage of Population Employed in Accommodation & Food Services in Beverly Hills, CA are:
What zip code has the Highest Percentage of Population Employed in Accommodation & Food Services in Beverly Hills, CA?
90211 has the Highest Percentage of Population Employed in Accommodation & Food Services in Beverly Hills, CA with 5.3%.
What is the Percentage of Population Employed in Accommodation & Food Services in Beverly Hills, CA?
Percentage of Population Employed in Accommodation & Food Services in Beverly Hills is 3.4%.
What is the Percentage of Population Employed in Accommodation & Food Services in California?
Percentage of Population Employed in Accommodation & Food Services in California is 7.2%.
What is the Percentage of Population Employed in Accommodation & Food Services in the United States?
Percentage of Population Employed in Accommodation & Food Services in the United States is 6.9%.