Zip Codes with the Highest Percentage of Population Employed in Accommodation & Food Services in Carson, CA
RELATED REPORTS & OPTIONS
Accommodation & Food Services
Carson
Compare Zip Codes
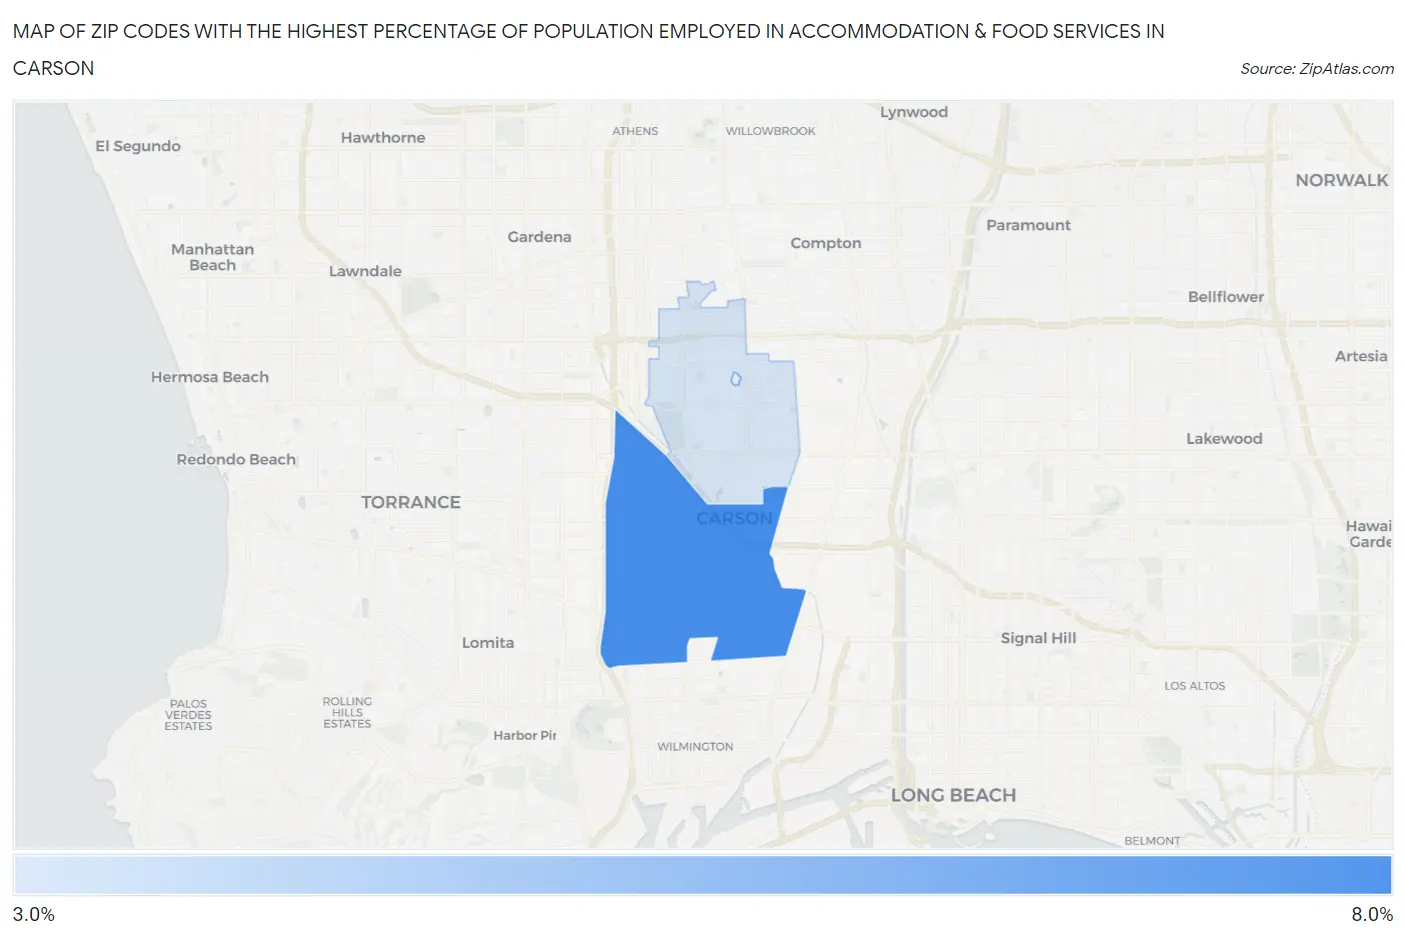
Map of Zip Codes with the Highest Percentage of Population Employed in Accommodation & Food Services in Carson
0.0%
8.0%
Zip Codes with the Highest Percentage of Population Employed in Accommodation & Food Services in Carson, CA
| Zip Code | % Employed | vs State | vs National | |
| 1. | 90745 | 7.3% | 7.2%(+0.141)#647 | 6.9%(+0.431)#9,481 |
| 2. | 90746 | 3.5% | 7.2%(-3.66)#1,350 | 6.9%(-3.37)#21,736 |
1
Common Questions
What are the Top Zip Codes with the Highest Percentage of Population Employed in Accommodation & Food Services in Carson, CA?
Top Zip Codes with the Highest Percentage of Population Employed in Accommodation & Food Services in Carson, CA are:
What zip code has the Highest Percentage of Population Employed in Accommodation & Food Services in Carson, CA?
90745 has the Highest Percentage of Population Employed in Accommodation & Food Services in Carson, CA with 7.3%.
What is the Percentage of Population Employed in Accommodation & Food Services in Carson, CA?
Percentage of Population Employed in Accommodation & Food Services in Carson is 6.0%.
What is the Percentage of Population Employed in Accommodation & Food Services in California?
Percentage of Population Employed in Accommodation & Food Services in California is 7.2%.
What is the Percentage of Population Employed in Accommodation & Food Services in the United States?
Percentage of Population Employed in Accommodation & Food Services in the United States is 6.9%.