Zip Codes with the Highest Percentage of Population Employed in Accommodation & Food Services in San Jose, CA
RELATED REPORTS & OPTIONS
Accommodation & Food Services
San Jose
Compare Zip Codes
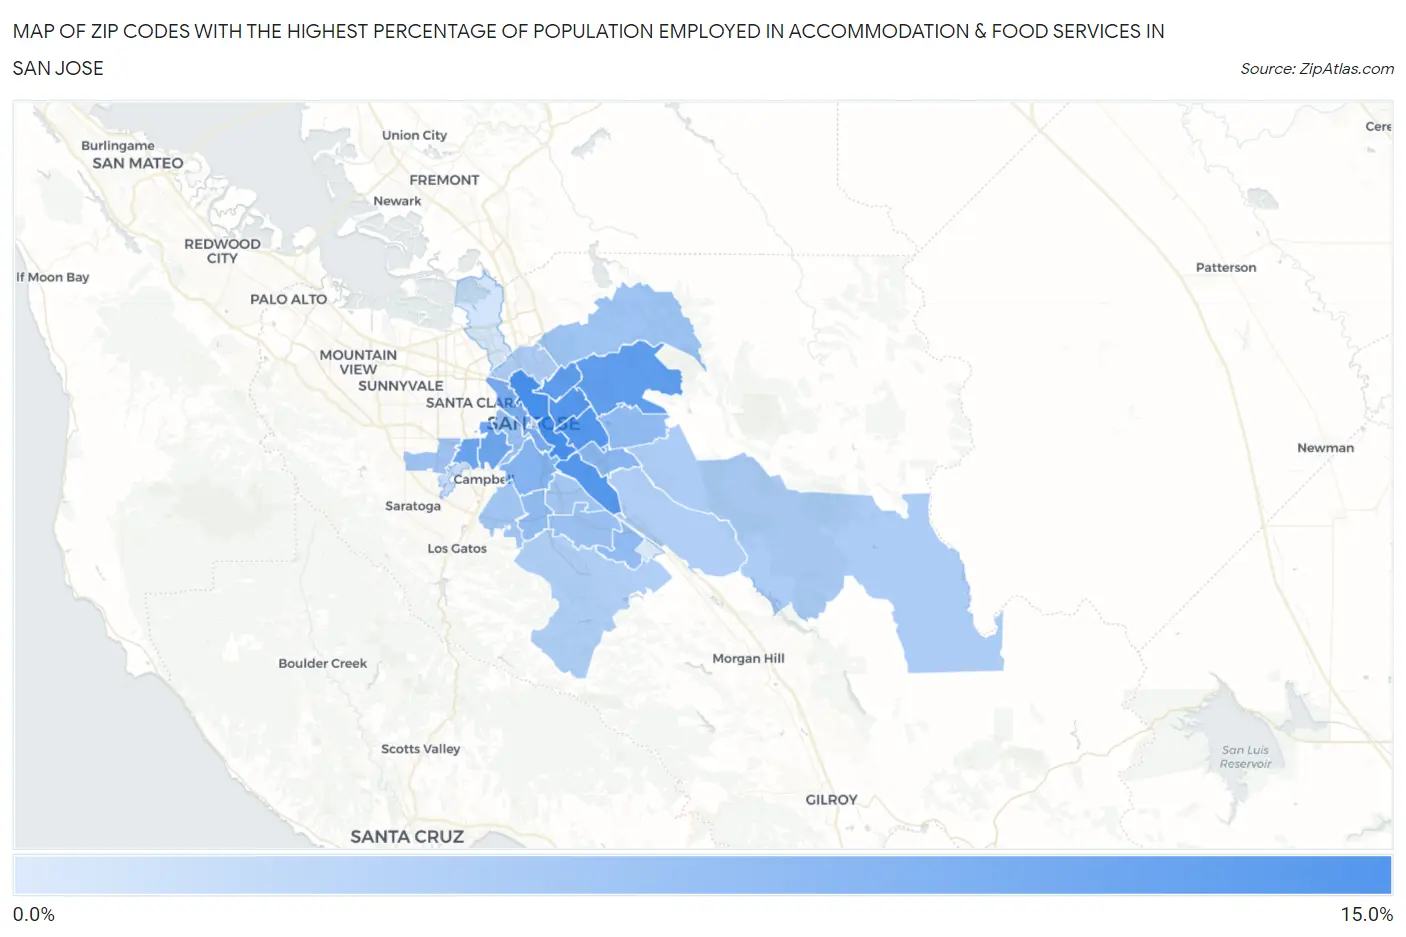
Map of Zip Codes with the Highest Percentage of Population Employed in Accommodation & Food Services in San Jose
0.0%
15.0%
Zip Codes with the Highest Percentage of Population Employed in Accommodation & Food Services in San Jose, CA
| Zip Code | % Employed | vs State | vs National | |
| 1. | 95112 | 10.7% | 7.2%(+3.55)#242 | 6.9%(+3.84)#3,784 |
| 2. | 95111 | 9.9% | 7.2%(+2.73)#302 | 6.9%(+3.02)#4,664 |
| 3. | 95116 | 9.9% | 7.2%(+2.68)#308 | 6.9%(+2.97)#4,719 |
| 4. | 95122 | 9.8% | 7.2%(+2.64)#314 | 6.9%(+2.93)#4,787 |
| 5. | 95133 | 9.2% | 7.2%(+2.08)#374 | 6.9%(+2.37)#5,577 |
| 6. | 95127 | 9.1% | 7.2%(+1.91)#391 | 6.9%(+2.20)#5,827 |
| 7. | 95117 | 8.5% | 7.2%(+1.30)#454 | 6.9%(+1.59)#6,865 |
| 8. | 95128 | 8.2% | 7.2%(+1.08)#494 | 6.9%(+1.37)#7,326 |
| 9. | 95110 | 7.6% | 7.2%(+0.385)#601 | 6.9%(+0.675)#8,847 |
| 10. | 95125 | 6.9% | 7.2%(-0.256)#737 | 6.9%(+0.034)#10,560 |
| 11. | 95121 | 6.6% | 7.2%(-0.607)#813 | 6.9%(-0.317)#11,639 |
| 12. | 95119 | 6.3% | 7.2%(-0.906)#879 | 6.9%(-0.616)#12,595 |
| 13. | 95148 | 6.2% | 7.2%(-0.936)#888 | 6.9%(-0.646)#12,691 |
| 14. | 95118 | 6.1% | 7.2%(-1.05)#906 | 6.9%(-0.756)#13,048 |
| 15. | 95126 | 5.8% | 7.2%(-1.39)#962 | 6.9%(-1.10)#14,125 |
| 16. | 95123 | 5.6% | 7.2%(-1.53)#994 | 6.9%(-1.24)#14,574 |
| 17. | 95132 | 5.4% | 7.2%(-1.76)#1,039 | 6.9%(-1.47)#15,376 |
| 18. | 95129 | 5.2% | 7.2%(-1.93)#1,077 | 6.9%(-1.64)#15,965 |
| 19. | 95136 | 5.2% | 7.2%(-2.00)#1,088 | 6.9%(-1.71)#16,202 |
| 20. | 95124 | 5.1% | 7.2%(-2.11)#1,107 | 6.9%(-1.82)#16,600 |
| 21. | 95113 | 4.6% | 7.2%(-2.52)#1,181 | 6.9%(-2.23)#17,991 |
| 22. | 95135 | 4.5% | 7.2%(-2.65)#1,208 | 6.9%(-2.36)#18,434 |
| 23. | 95131 | 4.5% | 7.2%(-2.66)#1,210 | 6.9%(-2.37)#18,456 |
| 24. | 95138 | 4.4% | 7.2%(-2.81)#1,232 | 6.9%(-2.52)#18,957 |
| 25. | 95120 | 4.3% | 7.2%(-2.83)#1,237 | 6.9%(-2.54)#19,028 |
| 26. | 95130 | 2.8% | 7.2%(-4.40)#1,429 | 6.9%(-4.11)#23,843 |
| 27. | 95134 | 2.3% | 7.2%(-4.82)#1,463 | 6.9%(-4.53)#24,835 |
| 28. | 95139 | 1.8% | 7.2%(-5.42)#1,497 | 6.9%(-5.13)#26,024 |
1
Common Questions
What are the Top 10 Zip Codes with the Highest Percentage of Population Employed in Accommodation & Food Services in San Jose, CA?
Top 10 Zip Codes with the Highest Percentage of Population Employed in Accommodation & Food Services in San Jose, CA are:
What zip code has the Highest Percentage of Population Employed in Accommodation & Food Services in San Jose, CA?
95112 has the Highest Percentage of Population Employed in Accommodation & Food Services in San Jose, CA with 10.7%.
What is the Percentage of Population Employed in Accommodation & Food Services in San Jose, CA?
Percentage of Population Employed in Accommodation & Food Services in San Jose is 6.8%.
What is the Percentage of Population Employed in Accommodation & Food Services in California?
Percentage of Population Employed in Accommodation & Food Services in California is 7.2%.
What is the Percentage of Population Employed in Accommodation & Food Services in the United States?
Percentage of Population Employed in Accommodation & Food Services in the United States is 6.9%.