Zip Codes with the Highest Percentage of Population Employed in Firefighting & Prevention in Oroville, CA
RELATED REPORTS & OPTIONS
Firefighting & Prevention
Oroville
Compare Zip Codes
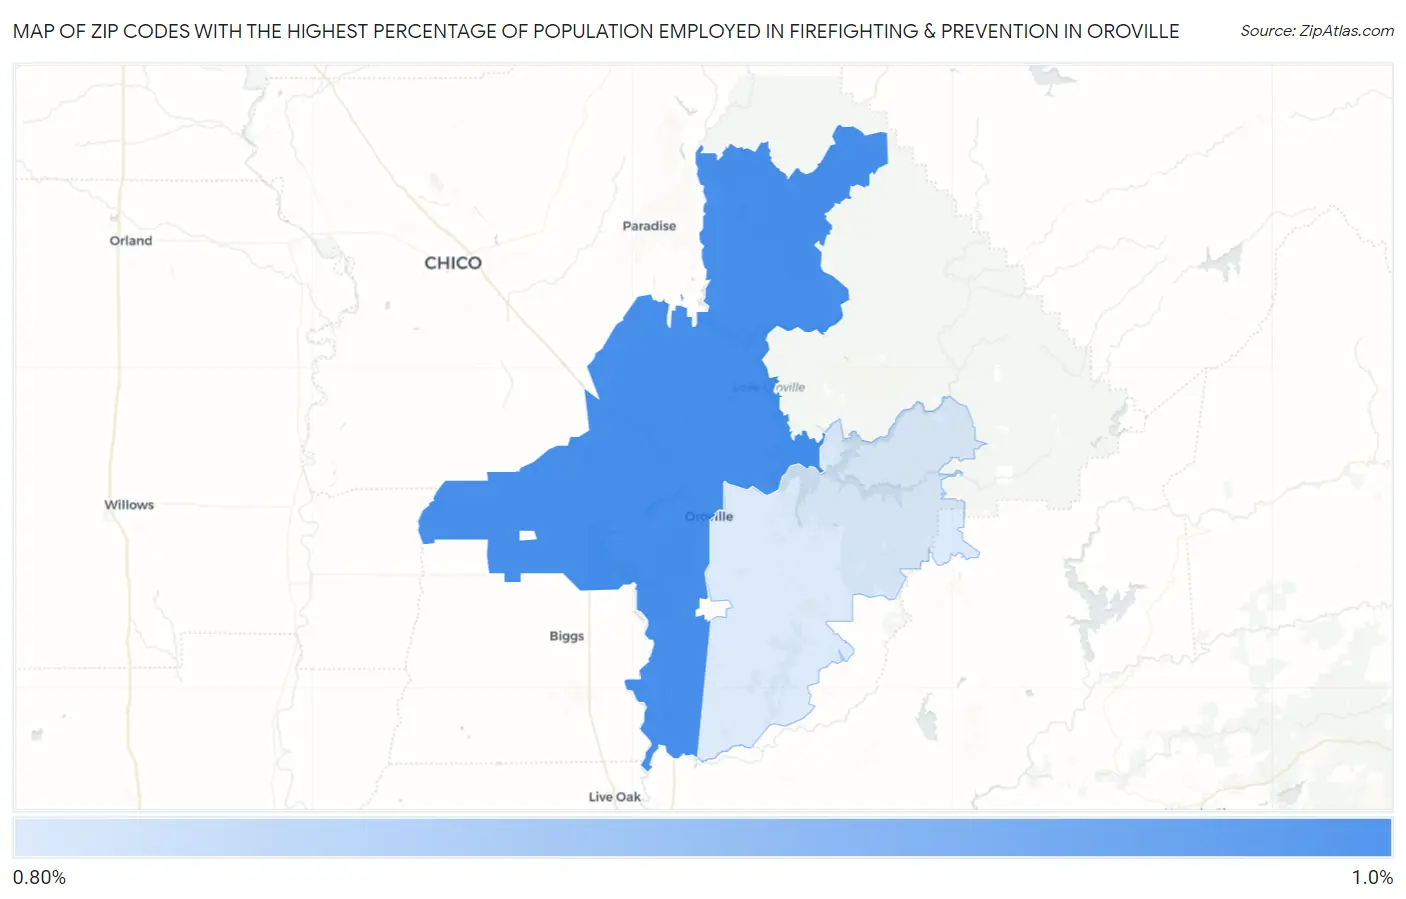
Map of Zip Codes with the Highest Percentage of Population Employed in Firefighting & Prevention in Oroville
0.0%
1.0%
Zip Codes with the Highest Percentage of Population Employed in Firefighting & Prevention in Oroville, CA
| Zip Code | % Employed | vs State | vs National | |
| 1. | 95965 | 0.99% | 1.3%(-0.287)#841 | 1.2%(-0.198)#11,214 |
| 2. | 95966 | 0.84% | 1.3%(-0.431)#943 | 1.2%(-0.342)#12,732 |
1
Common Questions
What are the Top Zip Codes with the Highest Percentage of Population Employed in Firefighting & Prevention in Oroville, CA?
Top Zip Codes with the Highest Percentage of Population Employed in Firefighting & Prevention in Oroville, CA are:
What zip code has the Highest Percentage of Population Employed in Firefighting & Prevention in Oroville, CA?
95965 has the Highest Percentage of Population Employed in Firefighting & Prevention in Oroville, CA with 0.99%.
What is the Percentage of Population Employed in Firefighting & Prevention in Oroville, CA?
Percentage of Population Employed in Firefighting & Prevention in Oroville is 1.4%.
What is the Percentage of Population Employed in Firefighting & Prevention in California?
Percentage of Population Employed in Firefighting & Prevention in California is 1.3%.
What is the Percentage of Population Employed in Firefighting & Prevention in the United States?
Percentage of Population Employed in Firefighting & Prevention in the United States is 1.2%.