Zip Codes with the Highest Percentage of Population Employed in Community & Social Service in Glendale, CA
RELATED REPORTS & OPTIONS
Community & Social Service
Glendale
Compare Zip Codes
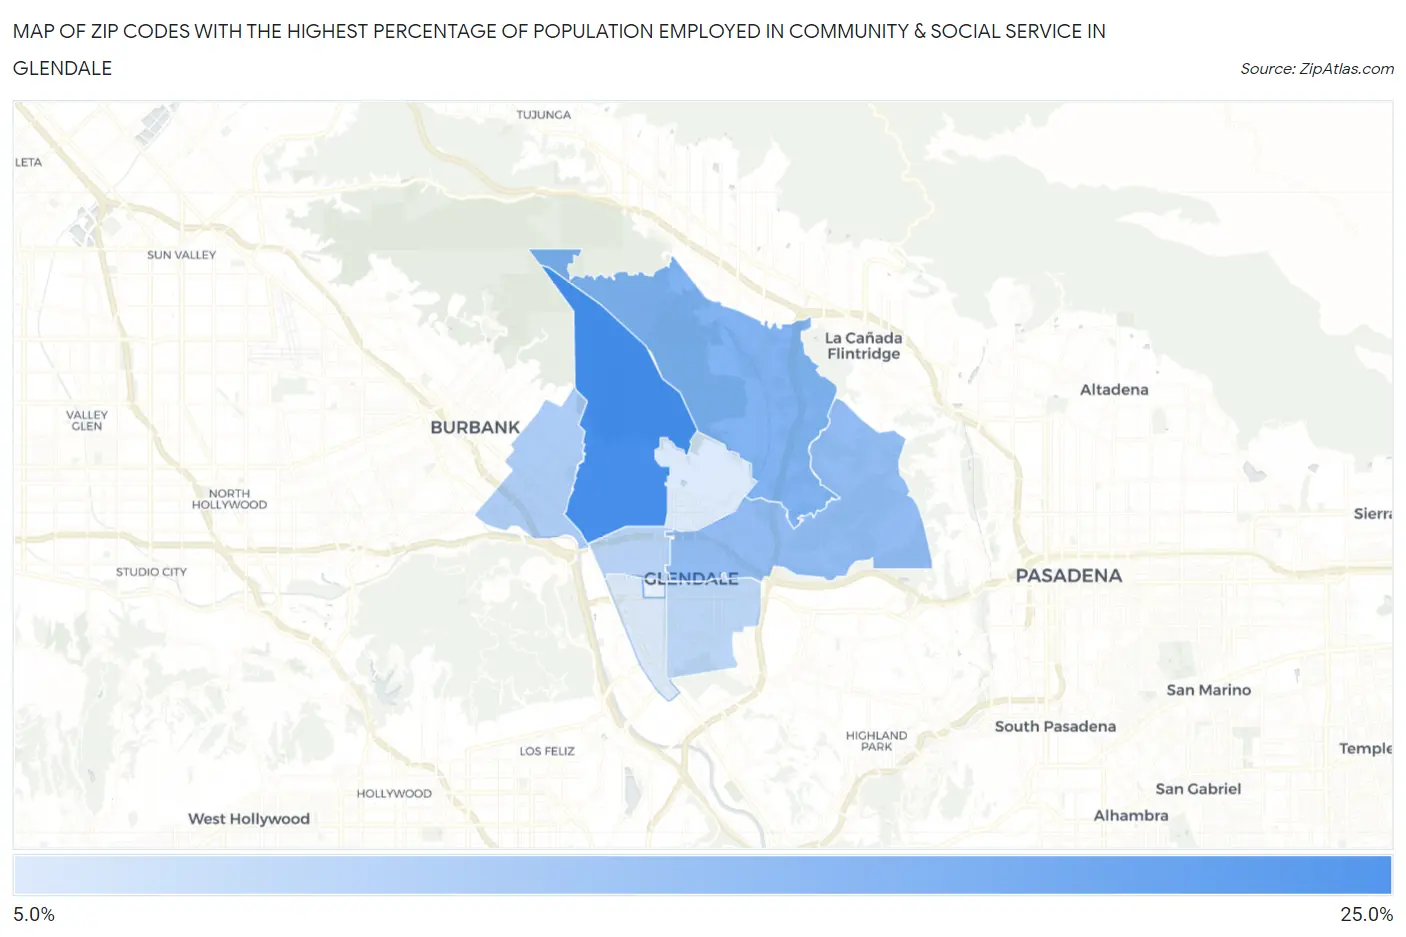
Map of Zip Codes with the Highest Percentage of Population Employed in Community & Social Service in Glendale
0.0%
25.0%
Zip Codes with the Highest Percentage of Population Employed in Community & Social Service in Glendale, CA
| Zip Code | % Employed | vs State | vs National | |
| 1. | 91202 | 20.9% | 11.5%(+9.45)#147 | 11.2%(+9.72)#1,727 |
| 2. | 91208 | 18.1% | 11.5%(+6.61)#215 | 11.2%(+6.88)#2,771 |
| 3. | 91206 | 17.3% | 11.5%(+5.82)#247 | 11.2%(+6.09)#3,180 |
| 4. | 91201 | 15.9% | 11.5%(+4.43)#320 | 11.2%(+4.70)#4,136 |
| 5. | 91203 | 15.4% | 11.5%(+3.89)#355 | 11.2%(+4.16)#4,632 |
| 6. | 91205 | 15.2% | 11.5%(+3.67)#371 | 11.2%(+3.94)#4,826 |
| 7. | 91204 | 13.8% | 11.5%(+2.27)#473 | 11.2%(+2.54)#6,406 |
| 8. | 91207 | 13.7% | 11.5%(+2.18)#480 | 11.2%(+2.45)#6,520 |
1
Common Questions
What are the Top 5 Zip Codes with the Highest Percentage of Population Employed in Community & Social Service in Glendale, CA?
Top 5 Zip Codes with the Highest Percentage of Population Employed in Community & Social Service in Glendale, CA are:
What zip code has the Highest Percentage of Population Employed in Community & Social Service in Glendale, CA?
91202 has the Highest Percentage of Population Employed in Community & Social Service in Glendale, CA with 20.9%.
What is the Percentage of Population Employed in Community & Social Service in Glendale, CA?
Percentage of Population Employed in Community & Social Service in Glendale is 16.9%.
What is the Percentage of Population Employed in Community & Social Service in California?
Percentage of Population Employed in Community & Social Service in California is 11.5%.
What is the Percentage of Population Employed in Community & Social Service in the United States?
Percentage of Population Employed in Community & Social Service in the United States is 11.2%.