Zip Codes with the Highest Percentage of Population Employed in Community & Social Service in Rancho Cordova, CA
RELATED REPORTS & OPTIONS
Community & Social Service
Rancho Cordova
Compare Zip Codes
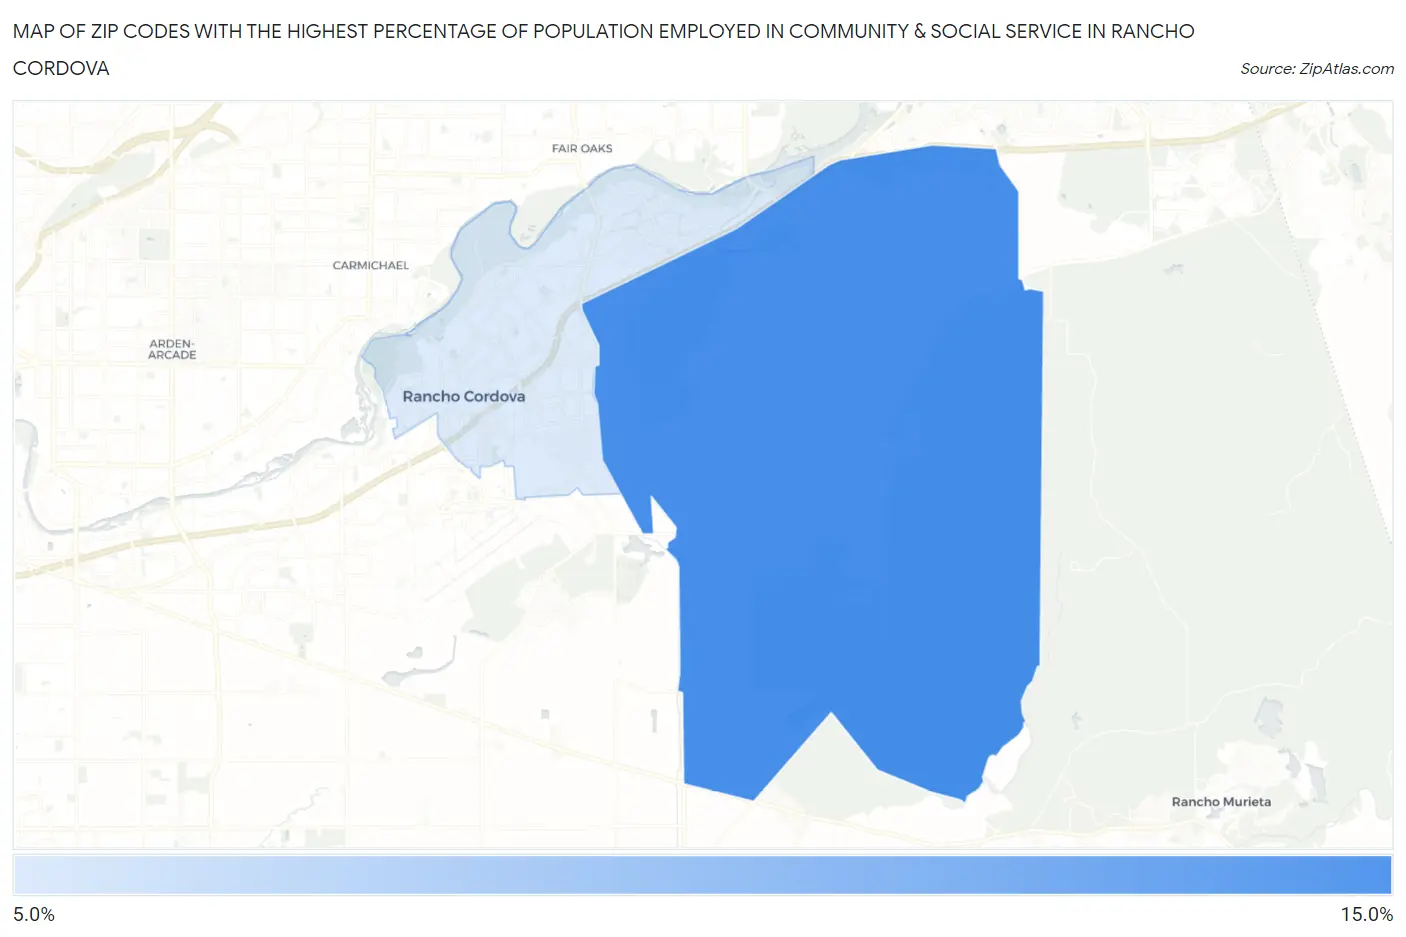
Map of Zip Codes with the Highest Percentage of Population Employed in Community & Social Service in Rancho Cordova
0.0%
15.0%
Zip Codes with the Highest Percentage of Population Employed in Community & Social Service in Rancho Cordova, CA
| Zip Code | % Employed | vs State | vs National | |
| 1. | 95742 | 11.6% | 11.5%(+0.163)#706 | 11.2%(+0.433)#10,122 |
| 2. | 95670 | 9.6% | 11.5%(-1.88)#965 | 11.2%(-1.61)#15,115 |
1
Common Questions
What are the Top Zip Codes with the Highest Percentage of Population Employed in Community & Social Service in Rancho Cordova, CA?
Top Zip Codes with the Highest Percentage of Population Employed in Community & Social Service in Rancho Cordova, CA are:
What zip code has the Highest Percentage of Population Employed in Community & Social Service in Rancho Cordova, CA?
95742 has the Highest Percentage of Population Employed in Community & Social Service in Rancho Cordova, CA with 11.6%.
What is the Percentage of Population Employed in Community & Social Service in Rancho Cordova, CA?
Percentage of Population Employed in Community & Social Service in Rancho Cordova is 9.1%.
What is the Percentage of Population Employed in Community & Social Service in California?
Percentage of Population Employed in Community & Social Service in California is 11.5%.
What is the Percentage of Population Employed in Community & Social Service in the United States?
Percentage of Population Employed in Community & Social Service in the United States is 11.2%.