Zip Codes with the Highest Percentage of Population Employed in Community & Social Service in San Gabriel, CA
RELATED REPORTS & OPTIONS
Community & Social Service
San Gabriel
Compare Zip Codes
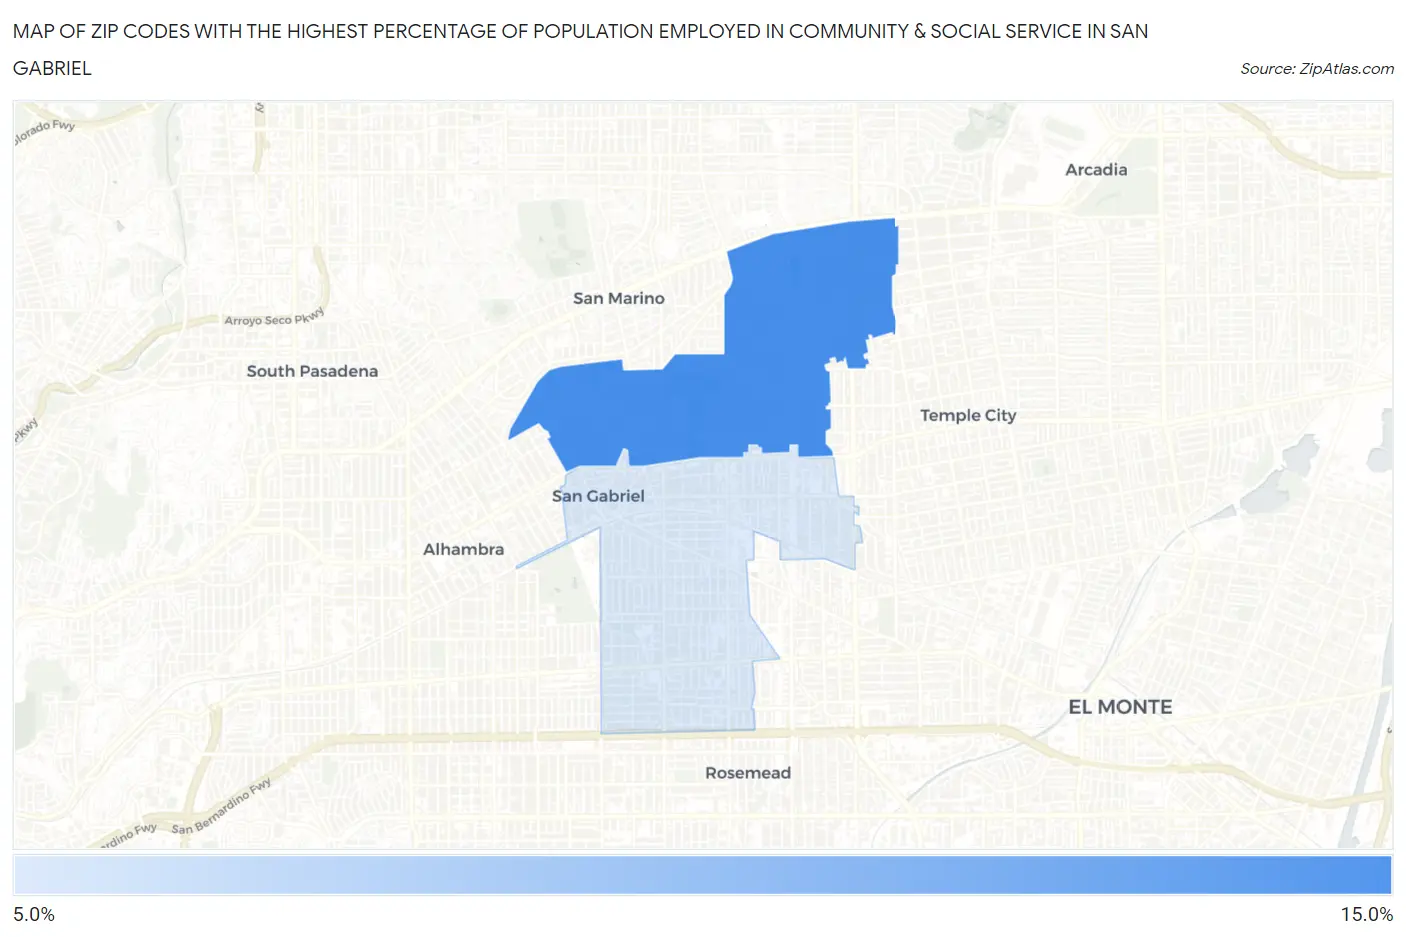
Map of Zip Codes with the Highest Percentage of Population Employed in Community & Social Service in San Gabriel
0.0%
15.0%
Zip Codes with the Highest Percentage of Population Employed in Community & Social Service in San Gabriel, CA
| Zip Code | % Employed | vs State | vs National | |
| 1. | 91775 | 14.5% | 11.5%(+3.01)#417 | 11.2%(+3.28)#5,475 |
| 2. | 91776 | 7.5% | 11.5%(-4.03)#1,225 | 11.2%(-3.76)#20,998 |
1
Common Questions
What are the Top Zip Codes with the Highest Percentage of Population Employed in Community & Social Service in San Gabriel, CA?
Top Zip Codes with the Highest Percentage of Population Employed in Community & Social Service in San Gabriel, CA are:
What zip code has the Highest Percentage of Population Employed in Community & Social Service in San Gabriel, CA?
91775 has the Highest Percentage of Population Employed in Community & Social Service in San Gabriel, CA with 14.5%.
What is the Percentage of Population Employed in Community & Social Service in San Gabriel, CA?
Percentage of Population Employed in Community & Social Service in San Gabriel is 9.6%.
What is the Percentage of Population Employed in Community & Social Service in California?
Percentage of Population Employed in Community & Social Service in California is 11.5%.
What is the Percentage of Population Employed in Community & Social Service in the United States?
Percentage of Population Employed in Community & Social Service in the United States is 11.2%.